Solana gained momentum after the August 5 market shock, but the trend turned around. What awaits SOL?
Solana (SOL) has been caught between two contrasting sentiments in August. From one point, there is the upcoming Solana ETF, memecoin rally, and MEW listing on WhiteBIT. On the other – investor reluctance.
Which scenario would Solana follow – find out below.
What Happened Before August 5 Panic
At the beginning of August, Solana has been indicating a positive sentiment. This stemmed from the clarity about Solana ETF approval. Particularly, the confidence about exchange-traded funds was expressed by Eric Balchunas, a Bloomberg analyst. In his post on X, he stated that Solana ETF may seek its approval in mid-March 2025.
“But between now and then the most impossible date is in November,” Balchunas added. “If Biden wins, these are likely DOA [ed. note – “dead on arrival”]. If Trump wins, anything is possible.”
Solana’s skyrocketing price dynamics were also granted by memecoin activity. One of the latest rising stars – cat in a Dogs World (MEW) was listed on the WhiteBIT exchange on July 23, securing 130% to its value afterward.
Read Also: XRP Traders Anticipate Bullish Rally with Promising 1:2 Payoff as Key Pattern Develops
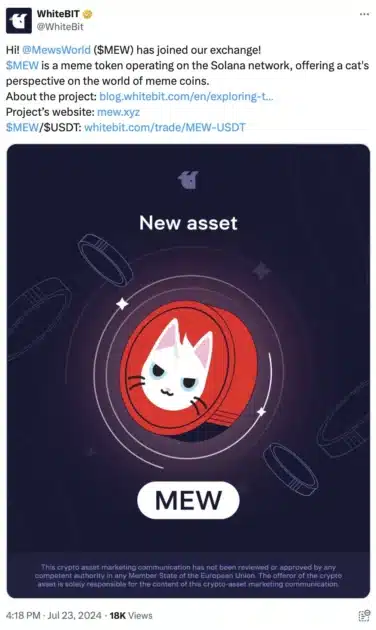
Source: WhiteBIT/X
Apart from this, the European exchange also introduced the crypto lending for MEW and MEW Bounty Program – a variety of tasks, for completion of which 250 winners will share the 6,000,000 MEW prize pool. Amid these positive updates, MEW has reached its historical milestone of $0.0096.
The memecoin rally and especially MEW’s uptrend swung up Solana’s on-chain activity. Specifically, the trading volume on the chain and total value locked (TVL) have seen a notable increase, with the latter standing at $5,436 billion.
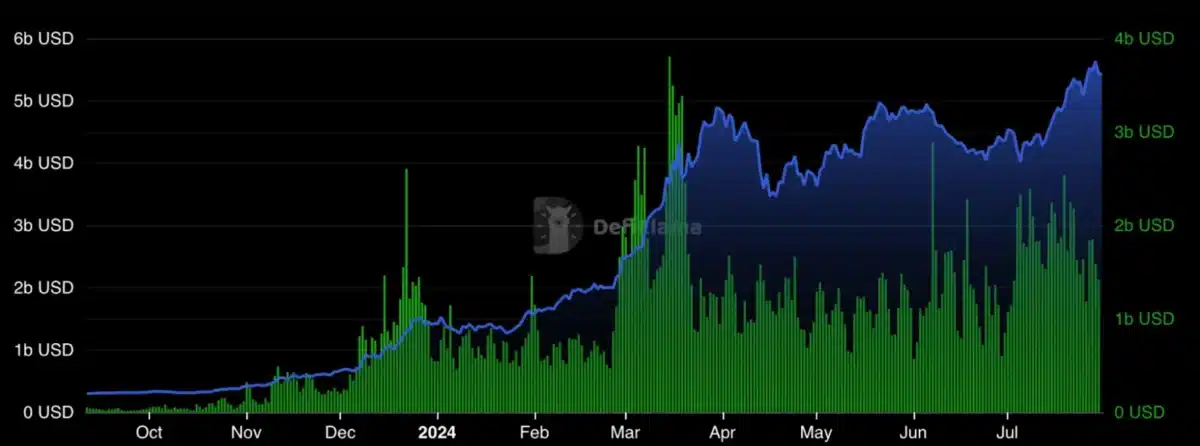
Solana volume and TVL as of July 31, 2024. Source: DeFi Llama
Solana Recovers After a 30% Slump
Amidst the August 5 global market downsurge, Solana kept on with a significant downward movement. Since July 29, which set up the bearish sentiment for SOL, the coin recorded a 30% decrease, reaching the local low of $109.93. However, on August 7, Solana saw a sharp bounce back. The coin exchanged hands at $139.87 at the writing time, securing a 26% uptick.
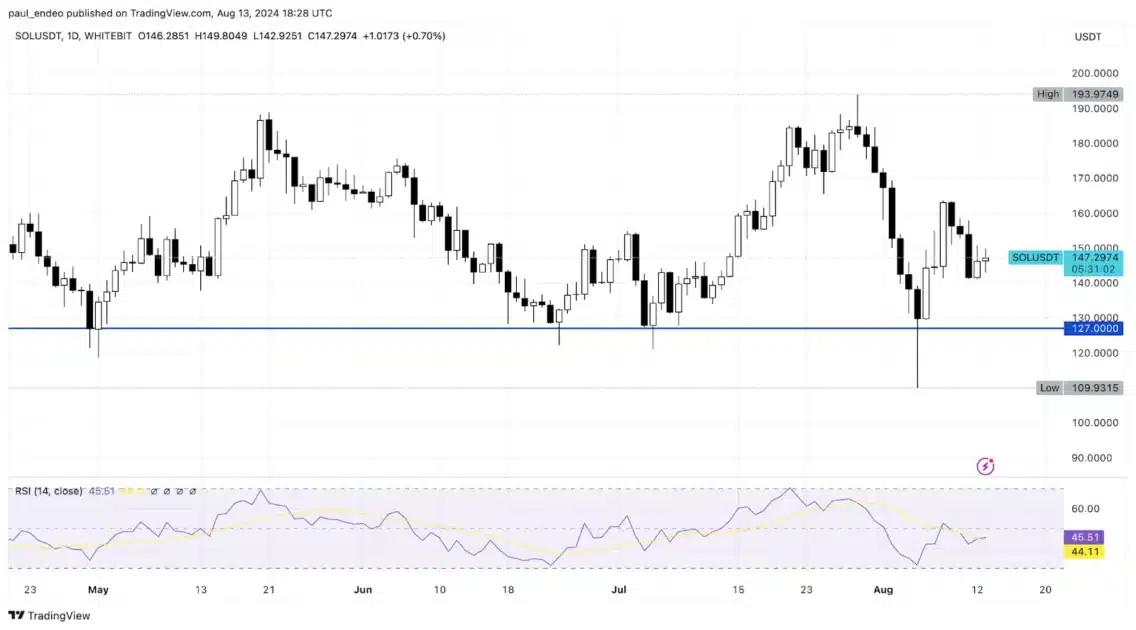
SOL/USDT 1D chart as of August 13. Source: WhiteBIT TradingView
Notably, the price could not breach the psychological level of support – $127. In 4 months, the market estimated it to be the bottom zone for Solana. By contrast, Solana experienced its highest daily on-chain activity in August. According to data from DeFi Llama, the volume has peaked at 27.11M SOL, the second-highest figure for the last two years, and the record in 4 months.
Read Also: Tether Expands Digital Currency Access via Aptos Blockchain Integration
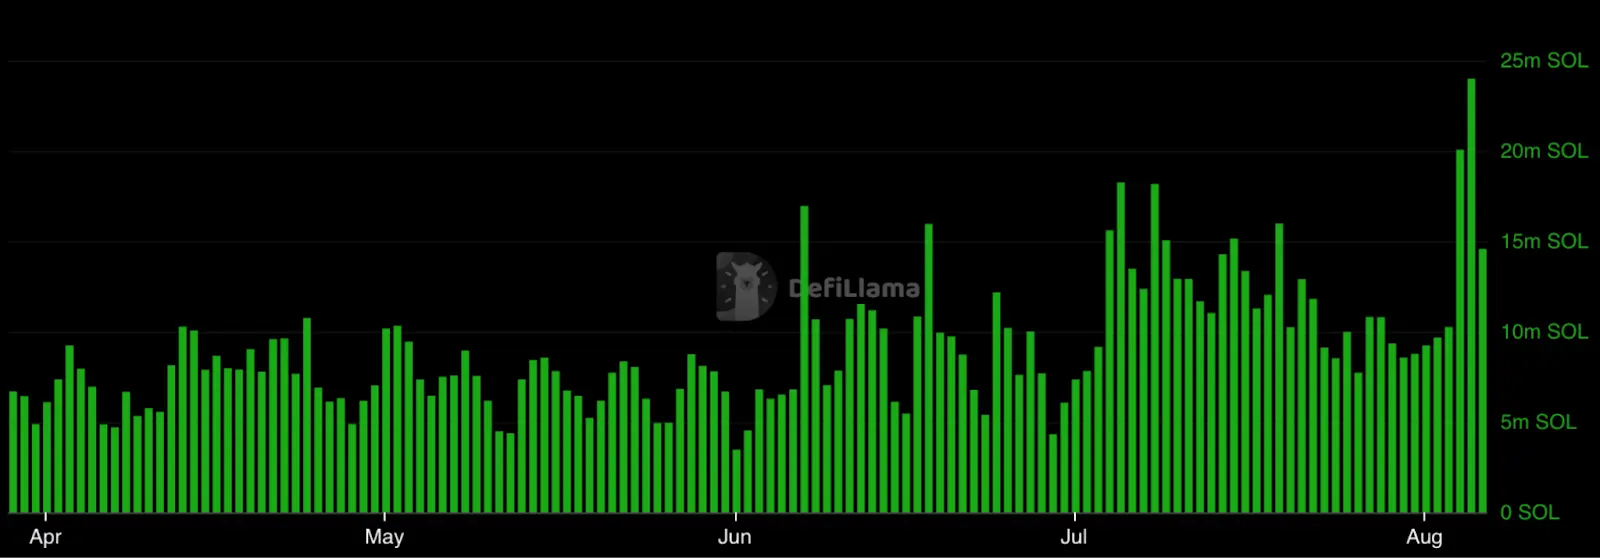
Solana daily volume. Source: DeFiLlama
The rise can be attributed to the skyrocketed buying activity, as traders have seen a chance to rack Solana at its lowest price. Solana’s total value locked (TVL) also indicated decent sustainability. Amidst the price drop, it has decreased by only 4.76 million SOL.
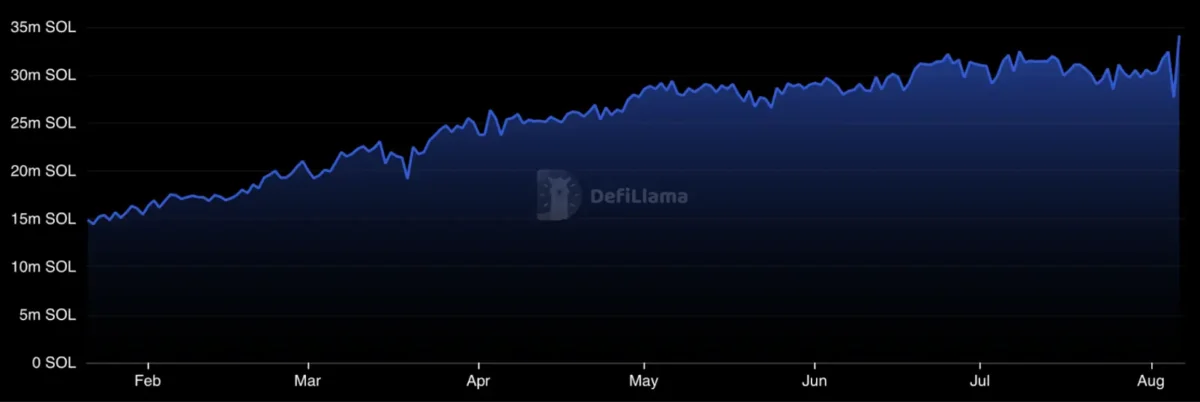
Solana total value locked (TVL). Source: DeFiLlama
This indicates that Solana was able to weather the storm quite well. However, the daily chart suggests that SOL is stuck between crucial support and resistance zones on the verge of the next move.
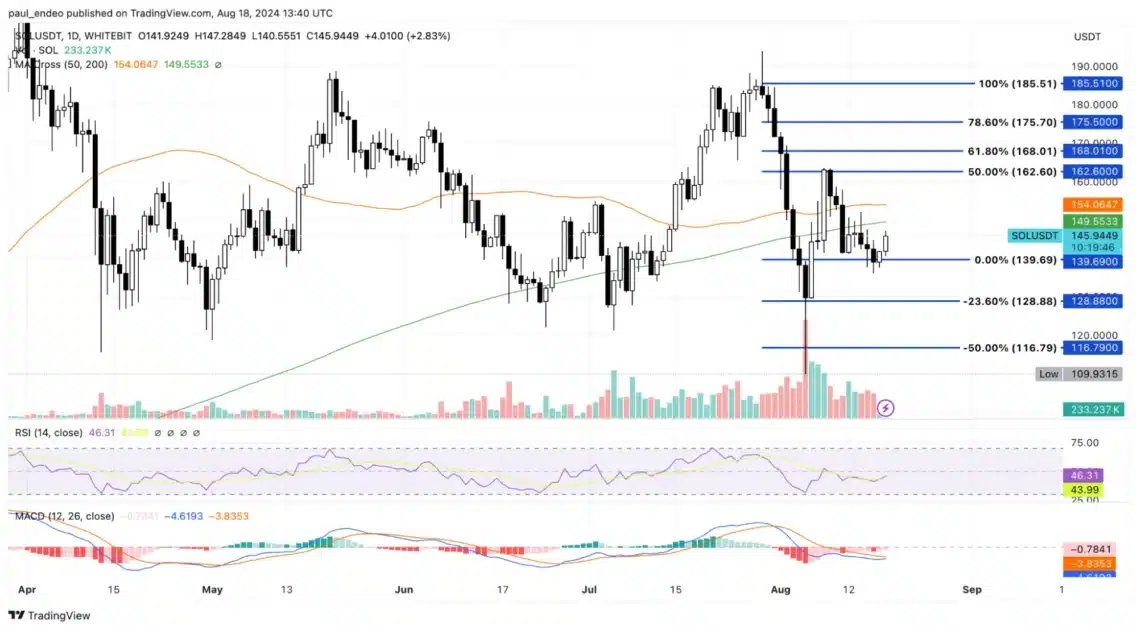
SOL/USDT 1D chart. Source: WhiteBIT TradingView
If the downward trend keeps on, the first significant support level will be at 23.60% Fibonacci retracement level at around $128.88. Unless the zone is locked in, SOL’s price may breach it to 50% Fib retracement at $116.79. Still, if SOL finds support at its current level of $145, it could signal the start of a recovery. This very recovery will be confirmed if Solana breaches 50-day and 200-day moving average levels. Ultimately, the next significant level to watch is the 61.80% Fibonacci retracement level at $162.60. A break above this level could signal stronger bullish momentum.
Solana is stuck in a decisive phase, given the current fundamental metrics. Nevertheless, traders should be aware of a turbulent geopolitical landscape, the upcoming U.S. election, and the September Fed meeting, which play a crucial role in shaping the market sentiment.
Read Also: Vitalik Buterin Reinforces Commitment to Crypto Privacy with Strategic Ethereum Transfers
