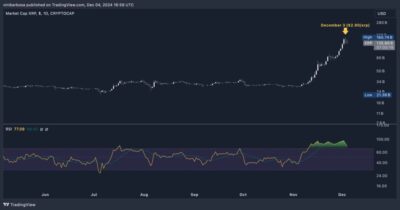
XRP, the native token of the XRP Ledger (XRPL), has been on a remarkable upward trajectory in November and early December 2024. On December 3, XRP achieved an all-time high (ATH) market cap of $165.74 billion, with the token trading at $2.90. Despite being below its ATH price of $3.40, this rally pushed XRP to the third spot by market cap, surpassing Solana (SOL) and Tether (USDT).

Source: CoinMarketCap
This surge in XRP’s market cap indicates increased demand but raises concerns due to the token’s growing circulating supply. Holding a 60% stake in XRP, Ripple has been gradually unlocking and selling its assets, which may fuel the price decline. With retail investors closely eyeing XRP’s performance, technical indicators suggest a potential correction.
Also Read: XRP Ledger Experiences Temporary Disruption, RippleX Pushes for Urgent Software Update
Technical Indicators Raise Red Flags
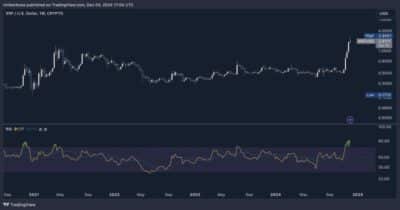
XRP’s technical charts signal an overbought condition, with its Relative Strength Index (RSI) indicating that the token may be due for a correction. Since November 11, XRP’s daily RSI has been above 75, reaching 95 during its ATH market cap.
Historically, such high RSI readings have often preceded significant pullbacks. The weekly RSI is also concerning, currently at 91.17, which previously led to a sharp 80% drop in late 2020 when the token’s price fell from $0.788 to $0.1713.

Source: Finbold
Also, the market has turned more liquid, with those holding long positions on XRP paying as high as a 66% annualized funding rate to those who are bearish, which could lead to a long squeeze and further bearish pressure on the token.
Despite these technical signals, XRP continues to garner attention, and its future performance remains uncertain as it faces both growing demand pressure and increasing market fatigue. Investors and traders will need to navigate carefully in this volatile and unpredictable environment.
Also Read: XRP Price Surge Drives Momentum, Ripple CEO Highlights Key Banking Challenges and Solutions
