Hedera Hashgraph’s native token, HBAR, has a maximum supply of 50 billion units. As of January 2021, around 7 billion HBAR tokens were circulated, representing about 14% of the total supply.
Hedera’s two founders each received grants of 2 billion HBAR, equaling 4% of the total supply per founder, subject to a six-year vesting schedule. This distribution ensures a structured release, minimizing sudden market impacts.
Also Read: Verge Price Prediction
Bollinger Bands Show Changing Market Dynamics
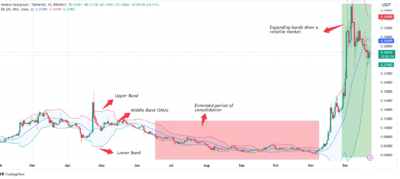
Bollinger Bands, consisting of upper, middle, and lower bands, expand and contract with market volatility. Extended consolidation saw HBAR’s bands remain contracted from mid-May to late November, reflecting stagnation.
However, the market has since opened up, with increased trading activity. HBAR is currently testing support at the lower band. The token may rebound toward the upper band from this level, signaling renewed price momentum.

Source: Tradingview
Relative Strength Index (RSI) Indicates Possible Trend Reversal
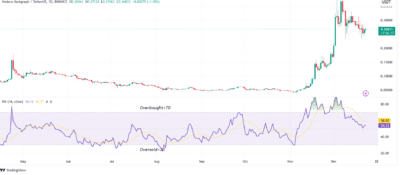
The RSI, which measures whether a cryptocurrency is overbought currently at 53 for HBAR. This neutral value suggests balanced market activity. However, the RSI lies below its SMA, indicating underperformance. If the RSI changes direction and crosses the SMA from below, it could signal a bullish trend reversal.

Source: Tradingview
The RSI can identify trend weaknesses, such as when it forms lower highs while HBAR’s price forms higher highs, signaling an impending reversal. Investors considering long positions should watch for the RSI crossing the SMA to confirm upward momentum.
MACD Highlights Short-Term Weakness
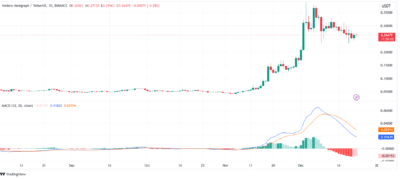
The MACD indicator compares two exponential moving averages (EMAs) and shows the MACD line below the MACD-SMA for HBAR. The value of 0.0183, combined with a widening gap and red histogram bars, reflects bearish pressure. However, potential buyer intervention could prevent the MACD from entering hostile territory, paving the way for the next upward price movement.

Source: Tradingview
Price Predictions: HBAR’s Potential from 2025 to 2028
The following table outlines HBAR’s predicted price trajectory based on current trends and market cycles:
| Year | Minimum Price | Average Price | Maximum Price |
| 2025 | $0.2 | $0.45 | $0.6 |
| 2026 | $0.25 | $0.35 | $0.45 |
| 2027 | $0.35 | $0.60 | $0.80 |
| 2028 | $0.80 | $1.25 | $1.50 |
Hedera (HBAR) Price Analysis for 2025
HBAR is currently trading within a symmetrical triangle pattern, and if it breaks out conventionally, it could reach $0.6 by 2025. Resistance at $0.45 may temporarily hinder progress, but surpassing this level could allow HBAR to exceed its 2021 peak of $0.6. However, as HBAR is in a downtrend, support at $0.2 may provide stability before its next rally.
Hedera (HBAR) Price Analysis for 2026
The cryptocurrency market is expected to enter a bearish phase in 2026. This cyclical downturn may result in HBAR losing some momentum gained during 2025. Price corrections could drive the token toward $0.35, creating accumulation opportunities for long-term investors.
Hedera (HBAR) Price Analysis for 2027
By 2027, the market may recover from the effects of the bearish phase. HBAR is expected to stabilize and gradually gain value, reaching an average price of $0.60. Traders and investors may remain cautious during this period, leading to slow but steady price increases.
Hedera (HBAR) Price Analysis for 2028
The anticipated Bitcoin halving in 2028 could reignite optimism across the crypto market. HBAR will likely benefit from this renewed enthusiasm, potentially reaching $1.5 by the end of the year. The resurgence of bullish sentiment and market activity may drive the token to new highs.
In conclusion, HBAR’s unique features and market trends suggest promising growth potential despite short-term challenges. Investors should monitor key technical indicators and market developments to make informed decisions.
FAQs
- What makes Hedera (HBAR) unique?
Hedera Hashgraph stands out for its distributed ledger technology, which is designed for speed, security, and scalability. HBAR powers network services like smart contracts and file storage. - How does the vesting schedule for founders’ tokens work?
Each founder received 2 billion HBAR, representing 4% of the total supply, under a six-year vesting schedule to ensure market stability. - What does the RSI indicate about HBAR’s performance?
The RSI at 53 indicates neutrality but suggests potential upward momentum if it crosses the SMA from below. - How does the MACD reflect HBAR’s price trends?
The MACD shows bearish pressure, but buyer intervention could prevent further declines, signaling a possible recovery. - What is HBAR’s long-term price outlook?
HBAR could reach $0.6 by 2025, $0.8 by 2027, and $1.5 by 2028, driven by market cycles and technological advancements.
Also Read: Shiba Inu (SHIB) Price Analysis: Predictions for 2024 to 2026
