Binance Coin (BNB), the native token of the Binance ecosystem, has evolved significantly since its launch in 2017. Introduced initially as a utility token for discounted trading fees on the Binance exchange, BNB has since expanded its role across various Binance-related projects, such as Binance Smart Chain, Binance Academy, Trust Wallet, and more. As one of the largest cryptocurrencies by market capitalization, BNB continues to experience notable price fluctuations, drawing the attention of traders and analysts alike.
Also Read: Velo (VELO) Price Prediction 2025-2029: Can VELO Price Break $5 Soon?
Binance Coin Technical Analysis: Bollinger Bands, RSI, and MACD
Bollinger Bands
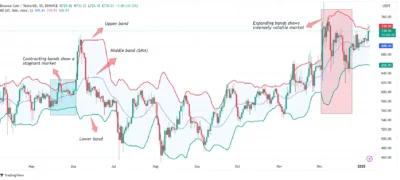
Bollinger Bands are a popular volatility tool that consists of three lines: the upper band, the middle band, which is a simple moving average, and the lower band. These bands flex depending on market fluctuations. In particular, when the price reaches the upper band, it indicates that the asset is possibly overbought, and conversely, when the price reaches the lower band, it could be oversold.
It should also be noted that BNB recently reached the upper Bollinger Band, indicating that the coin may have been overbought. This could indicate a possibility of the price coming down or possibly pulling back. However, with a general uptrend of BNB, any correction might be short-lived if the ascending sentiment is maintained.

Source: Tradingview
Relative Strength Index (RSI)
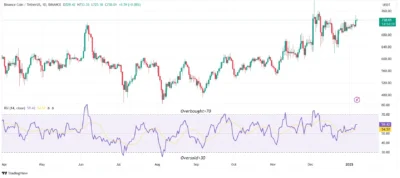
The RSI is a momentum oscillator that measures the speed and change of price movements on a scale of 0 to 100. A value above 70 suggests overbought conditions, while values below 30 indicate oversold conditions.
Currently, the RSI of BNB is set at 59, which falls within the neutral zone, suggesting that BNB is neither overbought nor oversold, meaning it could move further up or down. With the RSI indicator floating within this region, BNB can continue to push to higher levels without correcting downwards.

Source: Tradingview
Moving Average Convergence Divergence (MACD)
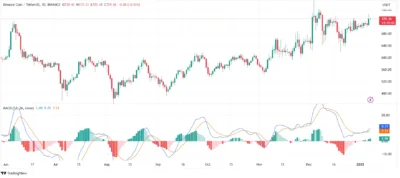
MACD is a helpful tool that demonstrates trends’ power based on two EMAs –the 12-day and 26-day moving average. Whenever the MACD line crosses the signal line above, it’s a bullish signal; when it crosses below the signal line, it is a bearish signal.
Currently, the MACD for BNB is 9.71, but the MACD line is above the signal line, supporting that the bullish prices are set to extend. This might mean that BNB could witness even more price surges in the short term, especially with a favorable market.

Source: Tradingview
Short-Term Price Prediction for BNB (2025)
Based on the current market conditions and technical indicators, Binance Coin is expected to experience some short-term consolidation, but the overall outlook remains bullish. The market will likely see some fluctuations as BNB tests key price levels.
| Date | Minimum Price | Average Price | Maximum Price |
| Jan 8, 2025 | $693.68 | $695.00 | $697.00 |
| Jan 9, 2025 | $693.77 | $695.20 | $698.50 |
| Jan 15, 2025 | $694.33 | $695.50 | $699.00 |
| Feb 7, 2025 | $696.46 | $698.00 | $701.00 |
Long-Term Price Prediction for BNB (2025-2029)
Binance Coin’s long-term price outlook remains strong due to its integral role in the rapidly growing Binance ecosystem. While short-term volatility is inevitable, BNB’s solid fundamentals provide a bullish outlook over the next several years.
Here are the long-term price predictions for BNB from 2025 to 2029:
| Year | Minimum Price | Average Price | Maximum Price |
| 2025 | $800 | $1,500 | $1,800 |
| 2026 | $500 | $512 | $750 |
| 2027 | $650 | $900 | $1,100 |
| 2028 | $1,000 | $1,350 | $1,800 |
| 2029 | $2,000 | $3,500 | $5,000 |
Conclusion
Binance coin has been in the market with a strong position because of the critical functions it performs within the Binance platform. Nevertheless, the short- and medium-term picture can provide some local highs and lows or even corrections for BNB; many long-term scenarios are possible. With a healthy level of adoption and as more ventures are created in association with Binance, the BNB will stand to gain increased value in the future. Some factors investors will have to adjust will soon be illustrated so that they, too, can take the necessary action by carefully observing the various technical indicators of the market situation.
FAQs:
1.What is Binance Coin (BNB)?
Binance Coin (BNB) is the native cryptocurrency of the Binance ecosystem, and it is used for various functions, such as paying transaction fees on Binance Exchange.
2.What are Bollinger Bands, and how do they affect BNB’s price?
Bollinger Bands are a volatility tool that helps measure the price movement of an asset. If BNB touches the upper band, it suggests overbought conditions and may signal a price pullback.
3.Is BNB’s price expected to rise or fall in the near future?
BNB may experience some price consolidation in the short term, but the overall trend remains bullish based on technical indicators.
4.What is the significance of the MACD for BNB’s price?
The MACD is a momentum indicator currently showing a positive value for BNB, suggesting that the cryptocurrency is in an upward trend.
5. How can I predict BNB’s price in the long term?
By analyzing technical indicators like RSI, Bollinger Bands, and MACD, along with broader market trends, investors can make educated predictions about BNB’s future price movements.
Also Read: Cardano (ADA) Price Prediction 2025-2029: Will ADA Price Reach $3.5 Soon?

