Gas (GAS), a vital component of the NEO blockchain, plays a pivotal role in powering transactions and smart contracts within its ecosystem. It is a utility token for transaction fees and incentivizes NEO holders and network participants.
As the cryptocurrency market continues to evolve, Gas is gaining significant attention, with analysts predicting notable price movements in the coming years.
Also Read: Binance Coin (BNB) Price Prediction 2025-2029: Will BNB Price Hit $1,800 Soon?
Bollinger Bands Analysis
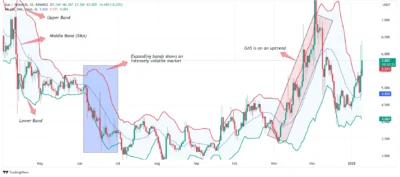
The Bollinger Bands indicator is something that every trader working with Gas should know and use consistently. They consist of three lines referring to upper, middle, and lower bands, which expand or narrow depending on price fluctuation. Real-time information shows that Gas’s price quickly rose from $3.5 to $7.5 within a month only to withdraw, which indicates high fluction.
Gas is currently at the upper Bollinger Band, indicating the currency pair is overbought, which often results in a pause as the market adjusts to fluctuations. Nevertheless, the Shirt_creation_p adjusted steadily in a given period, which means there might be possible scope for further uplifts depending on the trading volumes and pressure in the buying up equities.
Relative Strength Index (RSI)
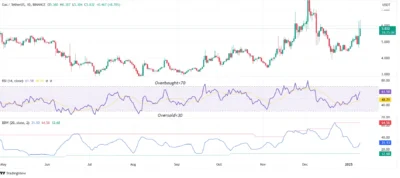
Based on the value trend, its Relative Strength Index or RSI determines whether the cryptocurrency is over-bought or over-sold. Currently, the value of RSI for the Gas is 61, which is still far from the overbought level of 70.
This indicates that although buying interest is on the rise, there is much more potential for price appreciation before the asset becomes over-bought.
The rise of the RSI demonstrates consistency with the general trends of the market, its bullishness in particular. Gas is suggested to approach the overbought territory if such a pattern continues and may further push the prices up in the short term.

Source: Tradingview
Gas (GAS) Price Analysis – Moving Average Convergence and Divergence (MACD)
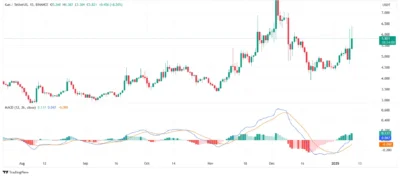
MACD indicator calculates momentum using two exponential moving averages, most often for 12-day and 26-day periods. For Gas, the MACD line is currently 0.047 above zero, and it has moved up from the MACD-SMA line.
There is an increase in the upward trend as green bars are shown to be getting more prominent in the histogram. These signals imply that Gas could be well placed to deliver higher returns and might point upwards if it receives market backing.
Read Also: Cardano (ADA) Price Prediction 2025-2029: Will ADA Price Reach $3.5 Soon?

Source: Tradingview
Gas (GAS) Price Prediction – Resistance and Support Levels
Understanding support and resistance levels is crucial for predicting Gas’s price movements. Currently, Gas has major buy orders at $4.5, which act as the base support whenever the prices are on a downside trend. The first significant confluence area is around $13, with another critical level at $15.
Gas (GAS) Price Prediction Table (2025-2029)
| Year | Minimum Price | Average Price | Maximum Price |
| 2025 | $8 | $15 | $22 |
| 2026 | $5 | $8.50 | $12 |
| 2027 | $5 | $10 | $16 |
| 2028 | $10 | $14 | $18 |
| 2029 | $25 | $35 | $55 |
Predictions for 2025-2029
2025
Gas is expected to see significant bullish momentum, with prices ranging between $8 and $22. The average price prediction is $15, supported by increased market activity.
2026
Following the bull run in 2025, a bearish phase may dominate, potentially pulling prices down to an average of $8.50, with a maximum cost of $12.
2027
The market is likely to consolidate, with Gas trading within a stable range of $5 to $16, averaging around $10 as it regains strength.
2028
A resurgence in the market, potentially fueled by the Bitcoin halving event, may propel Gas to prices between $10 and $18, averaging $14.
2029
A significant bull run could drive Gas’s price to new highs, with predictions ranging from $25 to $55, averaging around $35.
Conclusion
Gas (GAS) demonstrates a strong potential for growth in the coming years, supported by its integral role in the NEO ecosystem and favorable market indicators. While short-term corrections may occur, the overall trajectory is steady growth, particularly with key support at $4.5 and resistance near $15. Investors and traders should stay vigilant, as Gas’s price movements align closely with broader market trends and technical analysis signals.
FAQs
What is Gas (GAS) used in the NEO blockchain?
Gas is used to pay transaction fees and execute smart contracts within the NEO ecosystem.
What does the RSI value indicate about Gas’s performance?
An RSI value of 61 suggests that Gas is not overbought and has room for further growth.
What is the significance of Bollinger Bands for Gas’s price analysis?
Bollinger Bands indicate Gas’s price volatility, with expanding bands signaling potential price movement.
What is the current MACD trend for Gas?
The MACD shows positive momentum, with a value of 0.047 and an upward-trending histogram.
What are Gas’s critical support and resistance levels in 2025?
Gas has strong support at $4.5 and resistance levels around $13 and $15.
Also Read: Velo (VELO) Price Prediction 2025-2029: Can VELO Price Break $5 Soon?


