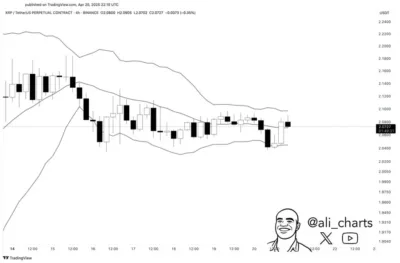
A closely monitored technical indicator on the XRP 4-hour chart is pointing toward a significant price shift in the near term. According to crypto analyst Ali Martinez, a recent Bollinger Bands squeeze highlights reduced volatility and signals a potential breakout in either direction.
XRP has shown signs of resilience after dipping to $2.03 on April 20 during a moment of market weakness. Since then, the token has recovered steadily, reaching a current price of $2.13, marking a 2.53 percent gain in the last 24 hours.
Over the past week, XRP’s performance has remained relatively flat, recording a modest increase of 0.06 percent. However, the latest chart patterns suggest that this consolidation may soon give way to more volatile movements.
Also Read: Expert Reveals Key Dates For XRP Holders to Observe, Says Now is the “Time to Lock in”
The Bollinger Bands indicator, which uses a 20-period moving average and standard deviation bands, has narrowed significantly. Martinez highlighted that XRP has been locked in a tight range between $2.04 and $2.12, indicating a squeeze phase.
Price action has struggled to close above the middle band, now situated around $2.08 to $2.09, showing visible resistance in that zone.
Meanwhile, buyers have consistently stepped in near $2.04, defending this support level as shown by several candlesticks with long lower wicks. This continued demand at the lower band strengthens the case for an impending move as the price compresses within a narrowing corridor.
Mixed Signals from Analysts on XRP’s Direction
While short-term technicals imply a volatile move could be near, market opinions differ on the likely direction. Analyst Doctor Cat has maintained a bullish outlook, forecasting a potential rise to at least $4.50. His prediction is based on Fibonacci extension targets and analysis of the XRP/BTC trading pair.
However, he also warned that a close below $1.69 on the two-day Ichimoku Cloud would weaken the bullish scenario. He estimated a 50 percent chance that XRP has already bottomed out, suggesting limited downside risk unless that key support breaks.
Adding a broader valuation perspective, JAN3 CEO and Bitcoin proponent Samson Mow recalculated XRP’s worth by dividing its market cap by Bitcoin’s fixed 21 million supply.
This method valued XRP at around $5,800 per Bitcoin-sized unit, highlighting the impact of token supply on perceived value. He used similar calculations for Ethereum and Solana to demonstrate how unit bias can mislead investors.
Conclusion
XRP’s compressed price movement under the Bollinger Bands framework indicates that a decisive move is approaching. With analysts split on whether that move will be upward or downward, all eyes remain on XRP’s next breakout signal.
Also Read: Analyst Reveals Bitcoin Price Could Hit $200K — If This Pattern Plays Out


