Binance Coin (BNB) is back in the spotlight as bulls attempt to reclaim higher ground amid a tightening price structure. As of May 26, 2025, BNB is trading near $674.40 after breaking above short-term resistance at $665. The coin’s recovery follows a descending wedge breakout, sparking optimism about a potential bullish continuation if momentum holds above key support.
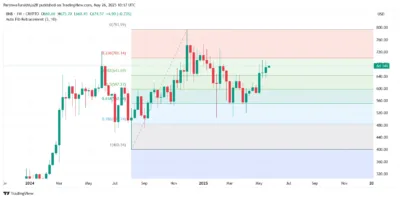
BNB’s recent price action signals stabilization, supported by strength in the broader crypto market and a bullish reclaim of the 0.382 Fibonacci retracement level from its November high near $793. While the short-term technical picture is encouraging, multiple indicators suggest consolidation could occur before any breakout beyond the $688–$692 range.
Also Read: Shiba Inu Price Prediction 2025–2029: Can SHIB Hit $0.00001760 Soon?
Technical analysis
BNB’s Price started rising last week after it became apparent that the token had moved above the $645 resistance trend. This area also touches a major supply zone from the past and has often preempted any price rise. The positive part is that the coin managed to stay above the $665–$668 support and the 20/50 EMA region.
The Fibonacci retracement supports this level, which has allowed BNB to return to about $643.69 as it faced resistance at $400 and $793. The positive part is that the coin managed to stay above the $665–$668 support and the 20/50 EMA region.
A tightening symmetrical triangle will form on the charts beneath the $688 price point shortly. Earlier, the Price dropped to $651 but quickly rose, hitting the upper limit set by the triangle. The trendline of this resistance pattern is now touching both the EMA100 and upper Bollinger Band at $681, making it a major point of interest in technical analysis.
In addition, volatility has declined substantially in the last 48 hours, as the 4-hour chart shows Bollinger Bands squeezing together—indicating that a breakout in either direction is likely imminent. Once bulls break the $681-$688 zone, BNB could rally to reach the area between $700–$715, with further potential upside up to $738. If support breaks below $664, the market may retreat to the $650 demand zone.

Source: Tradingview
At this point, several resistance levels converge for BNB and could reverse its bullish momentum. The range between $674 and $676 is immediate resistance because of trendline effects and the Bollinger Band midline. Above these, the $688–$692 zone can be considered the main ceiling since it touches the descending triangle apex and another significant supply zone.
At this point, multiple indicators meet, such as EMA100, Bollinger resistance, and the peak edge of the symmetrical triangle. A breakout on these support levels could result in a major shift and allow BNB to reach the $700–$715 zone. From a bad perspective, $665 and $651 might act as strong support walls, with help from old accumulation and moving averages nearby.
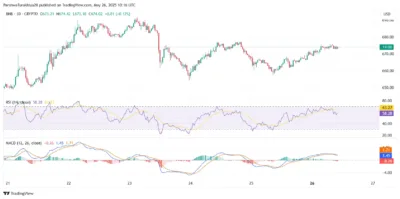
These indicators are prompting cautious optimism, with the RSI ranging between 58 and 63 on both the 30-minute and 4-hour timeframes—suggesting strong momentum without signaling overbought conditions. Still, MACD on the 4-hour chart is turning flat, and a weak bearish crossover indicates the possibility of a pause or tightening of the bullish momentum.

Source: Tradingview
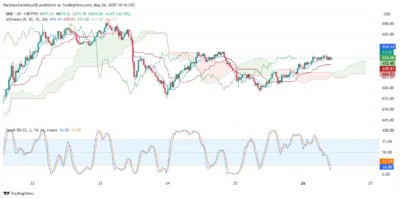
The bulls are still in favor, thanks to the Ichimoku Cloud, as both the Tenkan-sen and Kijun-sen lie below the current price, while the future cloud is green—suggesting that price could rise over the next few days. Even so, the Stochastic RSI is decreasing on the 30-minute chart from above 75, indicating a small break before another rise.

Source: Tradingview
BNB Price Prediction Table: 2025–2029
| Year | Minimum Price | Average Price | Maximum Price |
| 2025 | $620.00 | $690.00 | $738.00 |
| 2026 | $680.00 | $750.00 | $815.00 |
| 2027 | $720.00 | $800.00 | $890.00 |
| 2028 | $790.00 | $860.00 | $945.00 |
| 2029 | $840.00 | $910.00 | $1,020.00 |
Yearly Outlook
2025
After reclaiming the critical support, BNB is again rising and has pushed past $665. If we have a breakout over $692, the token could end the year at around $738. Caution is warranted, however, as consolidation could occur around $674–$688.
2026
As the rules become clearer and Binance adds new services, institutional and DeFi investors may start using BNB. When bullish, BNB might reach an average price of $750 and rise even higher to $815.
2027
The increased use of blockchain and tokens on Binance may help BNB reach $890. If NFT or cross-chain plans succeed, BNB has a chance to outperform major large-cap financial assets.
2028
BNB may get a boost because its supply is decreasing and is used in many DeFi projects. If the market stays bullish, prices might even hit $945, mainly when intense altcoin cycles are in place.
2029
Strengthening its position in the market and adding BNB to a wider range of solutions might help it reach $1,020. By then, BNB would be recognized as a utility token and a key cryptocurrency in the market.
Conclusion
BNB appears primed for a breakout since the Price forms a symmetrical triangle near the critical resistance range at $688–$692. A breakout for bulls above the $650 zone means a push to $700 or beyond is possible. Even so, the trend points to a possible pause before a significant breakout is seen.
BNB will most likely remain a leading player in the crypto market during the years 2025–2029 if keys like technical strengths, more users, and Binance support align with market conditions. A four-digit BNB isn’t impossible.
FAQs
1.Why is the BNB price rising today?
BNB broke above a descending trendline at $665 and reclaimed the 0.382 Fibonacci level, supported by a bullish EMA crossover and broader market confidence.
2. What is the next significant resistance for BNB?
BNB faces strong resistance between $688 and $692 and the breakout could propel it toward $700–$715.
3. Is BNB overbought?
RSI is below 65, though Stochastic RSI suggests a short-term cooldown may be near.
4. Can BNB hit $1,000 by 2029?
If adoption increases and Binance expands BNB’s utility, the token could reach $1,020 by 2029.
5. What’s the key support level to watch now?
BNB needs to hold $665 to maintain a bullish structure. Below that, $651 serves as the next demand zone.
Also Read: Ethereum Price Prediction 2025–2029: Can ETH Hit $6000 Soon?


