Pi Network has edged higher, climbing near $0.655 after a brief but notable breakout from a tight consolidation range. The token had been fluctuating between $0.648 and $0.656 since June 2 but is now showing signs of building upward momentum.
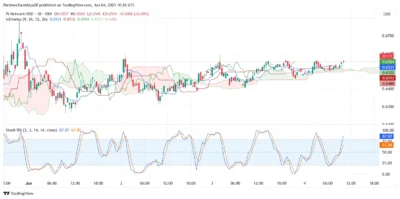
Technical indicators on the 30-minute chart confirm that price action has moved above the previous ceiling of $0.656. A downtrend line which played a role in limiting gains in previous sessions, is being put to the test. As a result of this, the price could head toward the $0.665 and $0.675 levels of resistance.
According to chart data, the Ichimoku Cloud now shows thin resistance just above the current level. At the same time, a bullish cross happening between the conversion and base lines hints that the short-term bullish trend is strengthening.

Source: Tradingview
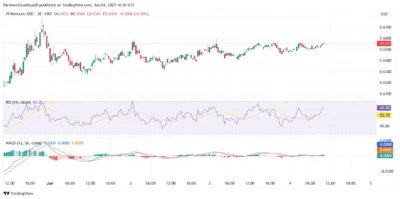
Momentum indicators are reflecting a mixed bias, with the Relative Strength Index climbing to 62.20 and signaling improving market sentiment. At the same time Stochastic RSI is above 80 in the overbought area, this could indicate the stock may be experiencing exhaustion.
Also Read: Vitalik Buterin Moves $1.8M in ETH to Secret Wallet After Huge Purchase
Key Indicators Point to Cautious Optimism Amid Technical Shift
The MACD shows a weak bullish crossover, with both lines hovering just above the zero mark. The Chande Momentum Oscillator has also climbed to 70.00, the highest level recorded since the end of May. This reflects a possible return of bullish interest, though the strength remains cautious.

Source: Tradingview
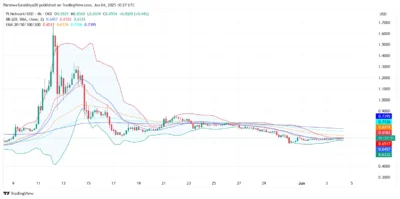
On the 4-hour chart, the price has gone above the 20-EMA, while Bollinger Bands are getting tighter. The upper Bollinger Band is close to be reached by the token as it stands at $0.658. But the 50 and 100 EMAs, especially the 100 EMA at $0.6774, resist the price from moving upward.

Source: Tradingview
Pi Network is still inside a declining triangle on its daily chart and its prices are being held down by support at $0.62 and resisted by trendline resistance at $0.695. A price break above $0.675 would show that the downtrend is reversing.
Pi Network moving above its short-term range is an apparent change in how the market operates. After forming resistance in the $0.665-$0.675 area, traders are closely observing to see if the market will continue to go up.
Also Read: XRP Legal Battle Ending? June 13 Rumored as Ripple’s Big Breakthrough
