The XRP community is closely watching the XRP/BTC chart after a key analyst pointed to emerging signs of a potential bullish reversal. The pair, which had been locked in a prolonged phase of sideways movement, now shows early technical formations that could shift its trajectory.
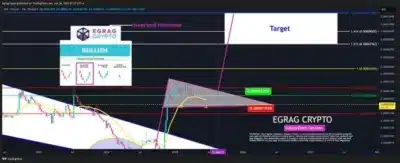
According to EGRAG CRYPTO, a well-known market analyst, the XRP/BTC chart is flashing critical reversal signals following a lengthy downtrend. A falling wedge pattern has evolved, squeezing the price action between resistance at 0.00002700 BTC and support at 0.00001930 BTC.
A recent inverted hammer candlestick was at the top of this wedge pattern. This trend, which can be expected at the end of a bearish trend, usually indicates a possible reversal of price action heading upwards. Its positioning in the vicinity of wedge resistance increases the weight of the current speculation of a breakout.

Source: X
Also Read: Max Keiser’s $1M Bitcoin Prediction Resurfaces in Rare Satoshi-Era Clip
The analysis conducted by EGRAG also marked a curved projection off the base of the wedge. This target spells out an anticipated parabolic increase in case the resistance line is shattered heavily on the bull side. The analyst expected that the “Target” zone would be at about 0.00009200 BTC, which is in line with the 1.618 Fibonacci extension.
Momentum Builds Around RSI Stabilization and Key Fibonacci Levels
Price has interacted with the 0.5 and 0.618 Fibonacci retracement levels, reinforcing the reliability of the current wedge formation. The 0.786 retracement level intersects with the 0.00002700 BTC zone, establishing it as a significant resistance point to monitor.
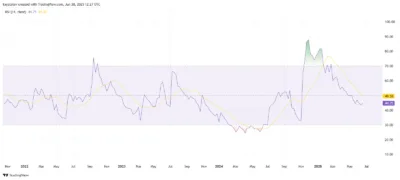
This developing feeling is evidenced by the Relative Strength Index (RSI) on the weekly XRP/BTC chart. The RSI then declined and fell beneath 50 after peaking well above 90 in a late 2024 rally. It currently sits at 44.75, which is a little below its 14-week moving average of 49.58.
Although the trend is still down, the recent activity implies decreasing bearish activity. The RSI has rebounded against the 40 mark, which is usually a base in bearish trends. Price increases have begun on this level in the past.
A widening gap between the RSI and its moving average signals an imminent shift. In the upcoming weeks, an occurrence where the RSI rises above its mean would help validate that sentiment has shifted toward bulls.

Source: Tradingview
The chart put on EGRAG also tips this expected trend change to the appearance of a sharp pink arrow, showing the trend advance channel in the event of resistance violation.
Conclusion
While XRP/BTC remains inside the wedge, multiple indicators point to the potential for a breakout. Chart patterns, Fibonacci levels, and momentum signals all support the possibility of renewed upward movement. Traders are now watching for volume confirmation to validate the emerging trend.
Also Read: SAHARA Price Prediction 2025–2029: Can SAHARA Hit $0.168 Soon?

