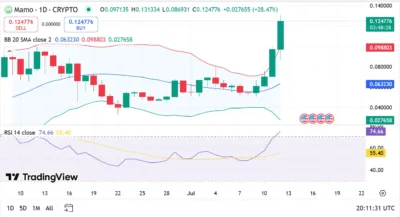
- Mamo explodes 28%, breaking resistance and drawing bullish trader attention.
- RSI surges past 74, signaling strong momentum for Mamo.
- Bollinger Band breakout hints at Mamo’s next price discovery phase.
Mamo (MAMO), a relatively quiet altcoin in recent months, has just erupted with a 28.47% surge, and the charts are lighting up like fireworks on the Fourth of July. With today’s price resting at $0.124776, MAMO isn’t just waking up — it’s charging forward with purpose.
After being left in years-long consolidation, Mamo finally surpassed crucial technical levels and has attracted the eyes of traders still looking around in search of a new breakout star. The onset of on-chain activity, accompanied by technical indicators showing green, raises the question not so much of whether MAMO is on the move but rather how far and how fast it can move.
Also Read: Kyber Network (KNC) Price Prediction 2025–2029: Can Kyber Network (KNC) Hit $1.00 Soon?
Technical Analysis
Bollinger Bands
MAMO has just made a dramatic entrance above the upper Bollinger Band, sending a clear signal: volatility has returned — and it’s favoring the bulls. The simple moving (SMA) average 20 has a value of $0.063230 with outer bands being extended far on both sides, that is, 0.027658 (lower side) and 0.098803 (upper side). The most recent candlestick, however, had not so much as touched the upper band but had sprung through it like a bullet.
This kind of breakout is usually a signal of a break in trends or the start of an aggressive leg up. Mamo has exported its force of gravity from its previous range and has acquired a different orbit of the price.
RSI Behavior
The relative strength index (RSI) currently stands at fifty-four points six six, which is way overbought territory. There is usually too much overbought when things are overbought in crypto. Together with the increasing RSI average (55.40 as of the time of writing), this is not an indication of a pullback but of an uptick.
Previously, the breakouts of this size may have been followed by RSI runs of more than 70, which results in multiple-day runs.
Support and resistance zone
The ideal reference point at this time is the location above the 20-day SMA of 0.063230, which has been turned into a support point instead of a form of resistance. The former upper Bollinger Band of $0.098803 is one step up and will act as a backup or some parachute in case the market makes temporary retracements.
As far as the resistance is concerned, it is being fought at the current high of $0.131334. A sudden breakout would open MAMO to the next level, with the price marking at $0.15 and the much-awaited mark of $0.20 in the future. This is not mere technical marks; it is a psychological mark by those investors who are looking at 2x returns.

Source: Tradingview
Mamo (MAMO) Price Prediction Table (2025–2029)
| Year | Minimum Price | Average Price | Maximum Price |
| 2025 | $0.06 | $0.11 | $0.18 |
| 2026 | $0.10 | $0.14 | $0.22 |
| 2027 | $0.12 | $0.17 | $0.26 |
| 2028 | $0.14 | $0.19 | $0.29 |
| 2029 | $0.15 | $0.21 | $0.33 |
Year-by-Year Price Breakdown
2025
This year could be MAMO’s coming-of-age story. With its recent breakout, the token could maintain an average price of $0.11 while targeting $0.18 if momentum continues to build. Even if the market cools down, support near $0.06 provides a soft landing zone.
2026
Assuming MAMO builds on current adoption trends and gets exposure through new DeFi partnerships or centralized listings, it could comfortably sit around $0.14. A bullish scenario could see it breach $0.22, setting a new standard for its valuation.
2027
At its peak, the token could rise to $0.26, especially as multi-chain DeFi interoperability gains steam. The average price may settle around $0.17 as new users enter and old resistance levels turn into new supports.
2028
With crypto markets maturing and institutional sentiment improving, MAMO could see broader adoption. This year, tech upgrades and ecosystem expansion may drive prices between $0.14 and $0.29.
2029
By the end of the first half of the decade, Mamo may have evolved into a more recognized digital asset. With sustained user confidence and precise market positioning, MAMO could reach a high of $0.33, with a strong average around $0.21.
Conclusion
Mamo has emerged from the shadows with strength and surprise. After weeks of silence, this 28% spike has put it squarely on the radar of breakout traders and long-term altcoin investors alike.
With bullish momentum, favorable RSI trends, and clean technical breakouts above the Bollinger Bands, MAMO looks ready to make a serious move. Though speculative, the fundamentals and price action align, pointing toward a possible climb to $0.20 or beyond within the following year.
FAQs
1. Is MAMO currently overbought?
Yes, with an RSI of 74.66, MAMO is in overbought territory. But this often reflects strong bullish trends during breakouts.
2. What is the key support level now?
The 20-day SMA at $0.063230 and the previous upper Bollinger Band at $0.098803 are critical supports.
3. What resistance must be broken for confirmation?
A close above $0.131334 would confirm bullish continuation and open the path to $0.15 and $0.20.
4. Can MAMO hit $0.20 this year?
With continued momentum, substantial trading volume, and no macro shocks, $0.20 is within realistic reach by late 2025 or early 2026.
5. What will drive MAMO’s long-term value?
Key drivers include increasing exposure, potential DeFi integrations, liquidity growth, and breakout momentum fueling investor interest.
Also Read: Satoshi Nakamoto Nears Buffett’s Wealth as Bitcoin Hits $129B Stash

