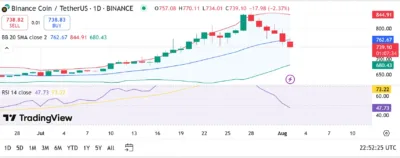
- BNB pulls back after a strong rally but finds footing near key support zones.
- Bulls watching closely as RSI dips toward neutral, signaling possible accumulation.
- Bollinger Band squeeze suggests a major move may be on the horizon.
Binance Coin (BNB), one of the most widely adopted utility tokens, is trading at $739.10, down 2.37% on the day. The current price action follows a notable uptrend throughout July, with recent selling pressure dragging the token closer to its mid-range Bollinger Band. Now traders are eyeing the charts for signs of whether BNB is due for a deeper correction—or preparing for another leg up.
Despite recent bearish candles, BNB remains in a long-term uptrend. With prices holding above significant support levels, and technicals indicating a potential rebound, the token may be preparing for a comeback in the months ahead.
Also Read: XRP to $1,000? Viral Post Sparks Frenzy as Ripple Moves Over $2 Billion in Massive Transfers
Technical Analysis
Bollinger Bands
BNB is currently trading just under the 20-day Bollinger Band midline at $762.67, which is a key pivot level. The upper and lower bands are at $844.91 and $680.43, respectively. The price now leans closer to the lower range, indicating cooling momentum and a potential buildup for volatility.
This setup often precedes a breakout — either up or down — depending on volume and sentiment. The contraction of the bands suggests reduced volatility and a likely squeeze scenario.
RSI Behavior
The Relative Strength Index (RSI) stands at 47.73, down from an overbought peak near 73.22. This move suggests that the earlier bullish wave has cooled off, with the RSI now sitting just below the neutral 50 mark.
A bounce from this level could hint at renewed bullish strength. However, a fall below 40 would put BNB in oversold territory, signaling caution but also a potential rebound zone.
Support and Resistance Zones
The immediate support lies at $680.43, the lower Bollinger Band. This area is crucial for bullish traders looking to defend the current trend. A further decline may push BNB toward psychological support near $700.00 and then $650.00.
On the resistance front, the next major hurdle is the 20-day SMA at $762.67. A close above this level could set the stage for a retest of $844.91 (upper band), and eventually a push toward the key psychological milestone of $900 and possibly $1,000.

Source: Tradingview
Binance Coin (BNB) Price Prediction Table (2025–2029)
| Year | Minimum Price | Average Price | Maximum Price |
| 2025 | $650.00 | $800.00 | $950.00 |
| 2026 | $770.00 | $920.00 | $1,100.00 |
| 2027 | $850.00 | $1,000.00 | $1,250.00 |
| 2028 | $940.00 | $1,180.00 | $1,450.00 |
| 2029 | $1,050.00 | $1,300.00 | $1,600.00 |
Year-by-Year Price Breakdown
2025
BNB may continue to range in the $700–$800 zone until a clear breakout or breakdown occurs. A sustained push above $762 could allow a retest of $900 or higher, while failure to hold above $680 risks a fall to $650.
2026
Increased BNB utility within Binance’s ecosystem and global DeFi adoption could drive the token toward the $1,100 zone. Continued innovation in Binance Smart Chain (BSC) and regulatory clarity may fuel bullish sentiment.
2027
BNB’s integration with Layer 2s, and growing enterprise use of BSC, could allow the token to breach $1,200, with average prices stabilizing near $1,000.
2028
Assuming ongoing ecosystem growth and favorable market conditions, BNB might challenge the $1,450 level, with broader crypto expansion acting as a tailwind.
2029
A mature Binance ecosystem and potential ETF listings or institutional inflows could send BNB to new highs, with $1,600 a realistic top in a strong macroeconomic environment.
Conclusion
BNB is currently in a short-term corrective phase, but the overall technical structure remains bullish. RSI levels point to a reset, while Bollinger Bands hint at a potential breakout setup. As long as the token holds key support levels, a rebound remains on the table.
The long-term forecast looks promising for Binance Coin, with ecosystem expansion, token burns, and real-world utility supporting upward momentum. BNB may not be far from reclaiming its bullish trajectory toward $1,000 and beyond.
FAQs
1. Is BNB currently oversold?
No. With an RSI of 47.73, BNB is in a neutral zone — not yet oversold, but no longer overbought.
2. What is the strongest support level right now?
The lower Bollinger Band at $680.43 is the strongest immediate support.
3. What resistance must be broken to confirm bullish momentum?
A daily close above the 20-day SMA at $762.67 would indicate a shift back to bullish conditions.
4. Can BNB hit $1,000 soon?
Yes, if BNB breaks above current resistance and broader market sentiment improves, $1,000 is achievable by late 2026 or 2027.
5. What are Binance Coin’s growth drivers?
BNB’s key drivers include its role in transaction fees, token burns, DeFi use cases, and increased demand for Binance ecosystem services.
Also Read: Trump to Sign Major Crypto Laws by August, White House Insider Confirms
