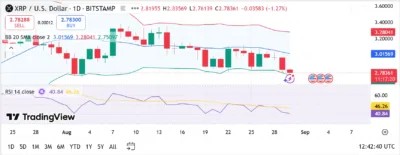
- XRP forms bearish descending triangle, signaling potential further price decline.
- Technical indicators show weakening momentum, with key support at $2.78.
- Bollinger Bands suggest XRP could face further downside or reversal soon.
XRP’s price action has raised concerns among traders, as the digital asset’s technical setup points to a potentially bearish future. Expert trader Peter Brandt has expressed a negative outlook on XRP, stating that its price action looks “very negative.”
As Brandt analyzed, XRP has been developing a descending triangle, a bearish indicator that tends to trigger additional losses. The major support level stands at $2.78, and below this, XRP can move with high downward movement.
In the recent past, XRP has experienced a decline of 6 percent this week, to an intraday low of $2.8 on the Bitstamp exchange. It is now traded at a third of its historical high of $3.67, which it reached in mid-July.
This fall is in line with the general decline in the cryptocurrency sector, in which other key digital currencies, such as Bitcoin, have experienced massive losses as well. The poor performance of XRP is an indication of the prevailing market mood, with the bears mounting on the market.
Also Read: Michael Saylor Unveils “Station ₿” Amid Bitcoin’s Price Fluctuations
Technical Indicators Point to Further Downside for XRP
A closer look at XRP’s chart reveals several technical indicators that support the ongoing bearish trend. The token is currently priced at $2.78361, reflecting a 1.27% decrease from the previous day. XRP has found it difficult to overcome resistance levels, which indicates that the down trend is bound to persist.
The Bollinger Bands point out that XRP is approaching the lower band at $2.75097, which is typically considered to be an oversold level. This may indicate a possible short-term reversal or additional bearish direction. Should XRP not hold above this level and fall below the lower band, further losses may be experienced, testing the lower support levels.
Besides, the Relative Strength Index (RSI) stands at 40.84, which indicates a neutral market. Although it is not oversold (under 30) yet, this indicates that XRP has a higher chance of additional downward pressure or entering a period of consolidation.
The new candlestick patterns depict a mixture of bearish red candles and small green candles, signifying weak buying power, which further supports the notion of a persisting bearish trend.
If XRP does manage to hold the support level near $2.75, it could see a brief price bounce. However, the prevailing technical indicators suggest that the token remains vulnerable to further declines if the broader market sentiment does not improve.
Also Read: AI Startup Sues X Corp. for Stealing Tech and Banning Founder’s Account


