- Coinskid identifies a long-term setup on XRP’s chart similar to BNB’s pre-rally structure, projecting a potential move above $6.
- XRP must break $3.18 resistance to confirm a breakout, while $1.90 remains critical support.
- Coinskid warns of possible shakeouts and corrections before continuation.
Popular crypto analyst Coinskid has once again highlighted a long-term bullish setup for XRP, projecting the potential for a move above $6, provided the ongoing technical pattern remains intact.
According to Coinskid, the structure forming on the daily timeframe closely resembles one previously observed on BNB, which ultimately led to a significant rally last year. However, he cautioned that XRP’s path upward won’t be smooth:
“There is a pattern that sends XRP to $6+ we’ve been tracking for a while now. Until the pattern breaks out, expect volatility — even bear trap shakeouts along the way.”
The analyst also noted that $1.90 remains a crucial technical support level, and losing that threshold would invalidate the bullish setup entirely.
There is a pattern that sends #xrp to $6+ we have been traking it for a while now. Until the pattern breaks out, expect volatility even bear trap shakeouts along the way.
The pattern is still at play. it’s a similar one we traded on #bnb last year except that it was being… pic.twitter.com/iXRkpKLI5h
— CoinsKid (@Coins_Kid) October 7, 2025
Also Read: XRP Holder Lists 1 Token for $1,000-Expert Explains Why It’ll Never Sell
XRP Faces Key Resistance at $3.18 as Momentum Builds
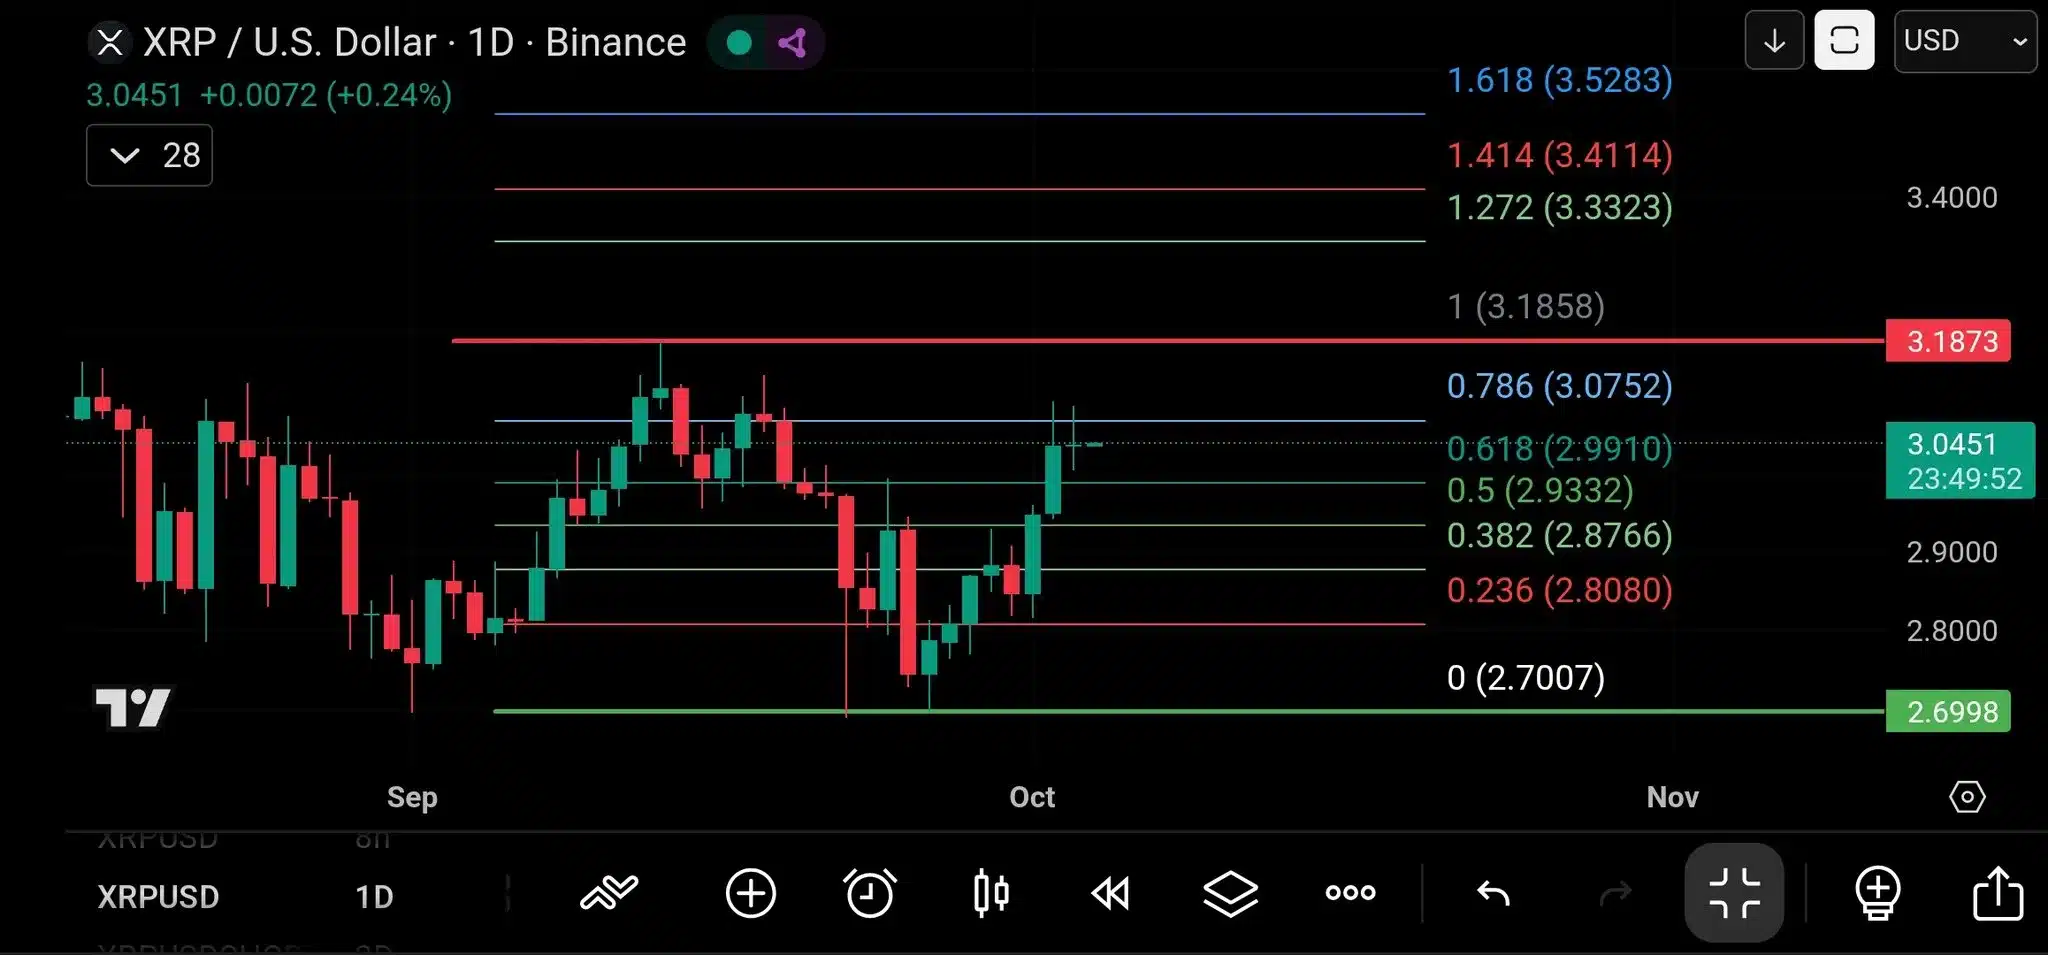
In a follow-up analysis, Coinskid examined XRP’s current market action, noting a strong pump into the 0.786 Fibonacci retracement level around $3.07. While this is a bullish sign, he emphasized that XRP must break the 1 Fib level near $3.18 to officially escape its downtrend — a structure that has persisted since July.

Source: Coinskid/X
“We have to see it take out the 1 fib to break out of this downtrend structure it’s been in since July, where it has been making lower highs,” he wrote.
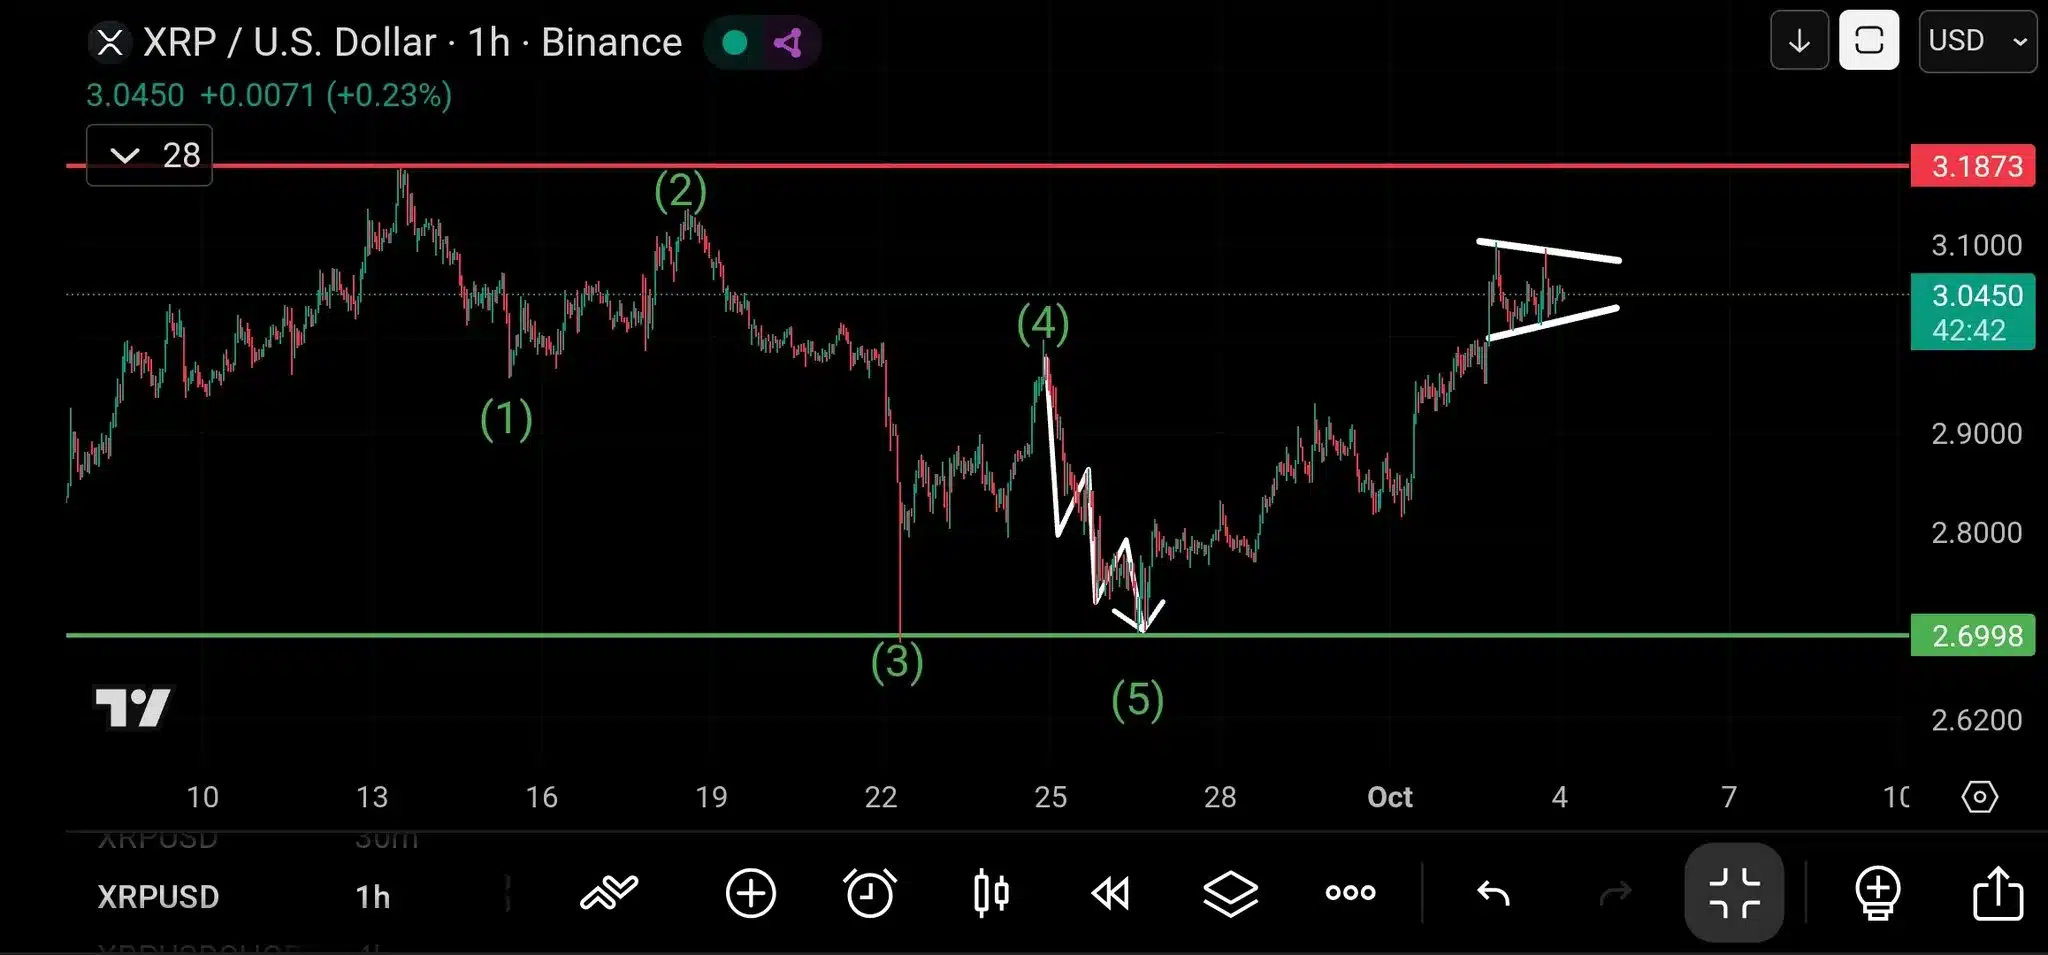
The accompanying daily and hourly charts support this analysis. The daily chart (XRP/USD on Binance) shows price action testing Fibonacci levels, with resistance marked at $3.18, and potential extensions up to $3.53 (1.618 Fib).
Support lies at $2.70 (0 Fib), a key level that could trigger a deeper correction if broken. Meanwhile, the 1-hour timeframe outlines a five-wave pattern, suggesting XRP may be forming a horizontal consolidation zone just below the $3.18 resistance.

Source: Coinskid/X
Coinskid cautioned traders about short-term volatility, noting that if XRP fails to break higher, it may undergo a five-wave move down, followed by a three-wave ABC correction before resuming its upward push.
Conclusion: Bullish Outlook, But Patience Required
Despite short-term uncertainty, Coinskid’s long-term outlook remains bullish. The $6+ target remains on the table as long as XRP holds above $1.90 and breaks decisively through $3.18 resistance.
While volatility and shakeouts may frustrate retail traders, the technical setup, supported by Fibonacci retracement levels and Elliott Wave patterns, continues to favor eventual upside for XRP. “The pattern is still at play,” Coinskid reiterated. “Stay patient. The structure is intact — for now.”
Also Read: 18,744,800 XRP Moved to Ripple Wallet Sparks Frenzy Over $55.9M Transfer
