- XRP rebounds above $2.35 but faces heavy resistance near $2.90.
- Coinglass data shows $22.3M inflows signaling cautious trader re-entry.
- Holding $2.35 support and breaking $2.90 key to bullish recovery.
XRP price is hovering near $2.49 after one of the sharpest single-day collapses in recent history. The token fell 42% hitting $1.64 before buyers staged a partial rebound above $2.35. Trading volumes surged 164% over the 30-day average, signaling capitulation and forced liquidations across major exchanges.
Despite the recovery, market sentiment remains fragile. Institutional open interest dropped by roughly $150 million, reflecting large-scale long unwinding that triggered the flash crash. Analysts note that although buyers stepped in aggressively at the lows, confidence among leveraged traders is yet to return.
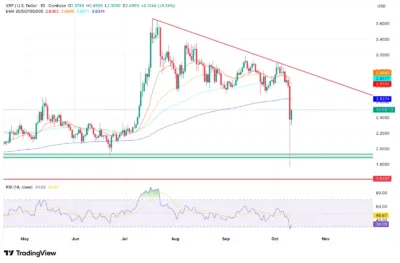
Besides, XRP’s daily chart shows a temporary bounce but sustained weakness below critical exponential moving averages. The 20-, 50-, and 100-day EMAs all sit around $2.83 to $2.84, forming a strong resistance zone near $2.88 to $2.90. Meanwhile, the 200-day EMA at $2.63 serves as a key support level that XRP must defend to avoid deeper losses.

Source: Tradingview
Also Read: SKALE (SKL) Price Prediction 2025–2029: Will SKL Reach $0.05 Soon?
Buyers Eye Breakout as Market Attempts to Stabilize
The Relative Strength Index currently reads near 47 after recovering from an oversold 34, indicating that bearish momentum has slowed. Still, price remains trapped under a descending trendline drawn from mid-year highs around $3.60. Unless XRP breaks this trendline, its overall technical setup remains slightly bearish.
New on-chain data from Coinglass shows early signs of stabilization. As of October 12, 2025, 03:00 UTC, XRP’s netflow stood at $22.30 million, while the price hovered near $2.3874. This mild inflow followed heavy outflows earlier in the week and suggests some traders are re-entering positions cautiously.

Source: Coinglass
However, analysts warn that the inflows remain small compared with prior outflows exceeding $28 million in late September. Futures open interest has yet to recover significantly, implying that institutional traders are still hesitant. Even so, the shift from persistent red flows to green bars on the chart shows early accumulation signs following last week’s capitulation.
Key Levels to Watch as XRP Trades at a Crossroads
Even with the rebound, XRP’s structure remains fragile below $2.90. The token recently broke under its 75-day symmetrical triangle, confirming a short-term bearish bias. Resistance is clustered between $2.84 and $2.90, aligned with the EMA band and descending trendline. A clear daily close above this range is essential to restore bullish momentum.
Failure to reclaim that zone could trigger renewed pressure toward $2.35 or even $2.22. Continued weakness in volume or another decline in open interest might also push XRP back toward $2.00 or the $1.80 support area seen during lows.
For XRP to strengthen its recovery on October 13, it must hold above $2.35 and break decisively above $2.90. A successful breakout could pave the way to $3.05 and later $3.30, signaling a reversal of recent losses. Conversely, slipping below the 200-day EMA at $2.63 could open the door to further declines near $2.20.
As of now, XRP trades in a cautious recovery mode with neutral to slightly bullish bias while holding above $2.35. The short-term outlook remains balanced between the potential for a relief rally and the risk of a deeper correction.
Also Read: Omni Network (OMNI) Price Prediction 2025–2029: Can OMNI Reach $5.00 Soon?
