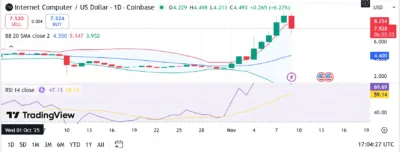
- ICP extends its recent breakout as bulls push toward the $7.50 level.
- Bollinger Bands widen sharply, hinting at high volatility and trend continuation.
- RSI hovers just below overbought range, signaling possible cooling before further upside.
Internet Computer (ICP) has surged impressively after a prolonged period of accumulation, catching market attention and signaling a potential trend reversal. Traders are now watching closely as ICP attempts to maintain momentum and build toward higher resistance levels.
At press time, ICP trades near $7.52 after gaining more than 6% in the past 24 hours. The recent rally follows a strong multi-day bullish move, though the latest candle shows early signs of profit-taking. This could indicate a brief pause before another push higher if market sentiment holds.
Also Read: Kelp DAO Restaked ETH (rsETH) Price Prediction 2025–2029: Can rsETH Hit $12,000 Soon?
Technical Analysis
Bollinger Bands
Bollinger Bands on the daily chart have expanded aggressively following the recent breakout. The upper band is near $5.15, the mid-band (20-day SMA) sits around $4.55, and the lower band stands close to $3.95.
Price currently trades above the upper band, a sign of strong upward pressure but also an indication that the market may be overheated in the short term. If ICP can stay above $7.00, continuation toward $8.25 and eventually $10.00 becomes more likely. A drop back inside the upper band, however, could signal profit-taking and lead to a retest of support around $6.00 and the $4.40 region.
The widening of the bands reflects rising volatility often seen during early-stage bullish expansions.
RSI Behavior
The RSI reads about 69.69 while its moving average sits near 59.14. This places ICP on the edge of overbought territory. A brief pullback or consolidation could occur soon if buyers begin to cool down.
If the RSI remains above 60 after a dip, traders may view it as a trend continuation signal, which could keep ICP on track toward $9–$10 targets in the coming weeks. A drop below 55 would be an early warning of weakening momentum.
Support and Resistance Levels
In the current setup, Internet Computer finds strong support around $6.00, which acts as the first line of defense for bulls trying to maintain momentum. A deeper support zone lies near $4.40, aligning closely with the 20-day simple moving average, where buyers have previously shown strong interest. On the upside, immediate resistance appears near $7.50, followed by a more critical level at $8.25. If the price can break above this area with sustained volume, the next target could extend toward $10.00, marking a significant psychological milestone for the market.
Holding above the $6.00 region remains crucial for preserving the bullish structure. A failure to maintain this level could push ICP back into its earlier consolidation range, delaying any potential breakout and weakening short-term sentiment.

Source: Tradingview
Internet Computer (ICP) Price Forecast 2025–2029
| Year | Minimum Price | Average Price | Maximum Price |
| 2025 | $4.00 | $6.50 | $8.50 |
| 2026 | $6.50 | $8.00 | $10.00 |
| 2027 | $8.00 | $10.50 | $13.00 |
| 2028 | $10.50 | $13.00 | $16.50 |
| 2029 | $13.00 | $17.50 | $22.00 |
2025
ICP is expected to trade between $4.00 and $8.50 through 2025. The recent breakout shows momentum shifting in favor of bulls, though some consolidation may occur before a full trend continuation.
2026
As Web3 adoption expands and decentralized computing gains traction, ICP could average around $8.00, potentially breaking $10.00 during bullish cycles.
2027
Institutional interest and ecosystem growth could lift ICP to the $10.50–$13.00 range. Application development and on-chain hosting growth may play major roles.
2028
A maturing digital infrastructure market and increased developer activity could push ICP toward $16.50. At this stage, market cycles and blockchain scaling demand would likely drive price behavior.
2029
If adoption and technology execution remain strong, ICP could achieve $22.00, positioning the network as one of the leading decentralized compute ecosystems.
Conclusion
ICP has entered a high-momentum phase with strong upside pressure following a breakout. The RSI suggests caution in the short term, but the expanding Bollinger Bands and sustained volume show that traders are prepared for volatility and continuation.
If ICP holds above the $6.00 level and successfully breaks through the $7.50–$8.25 zone, long-term recovery toward $10.00 and beyond looks increasingly achievable.
FAQs
1.Why is ICP rallying now?
ICP recently broke out of a long accumulation range, triggering technical buying and renewed investor interest.
2. Is ICP overbought?
RSI is near overbought levels, suggesting short-term pullback potential before another leg up.
3. What price must ICP break to target $10?
A break above $7.50 and confirmation over $8.25 would strengthen the case for a move toward $10.00.
4. Can ICP realistically reach $10 again?
Yes. Technical and fundamental conditions support the potential return to double-digit prices within the next cycle.
5. Is ICP a good long-term investment?
With decentralized cloud computing demand expanding, ICP remains a strong long-term blockchain infrastructure project, though volatility will always be a factor.
Also Read: Virtuals Protocol (VIRTUAL) Price Prediction for November 3: Bulls Eye Breakout Toward $2.10

