


- BNB Chain leads all blockchains with 15 million monthly stablecoin addresses, reflecting strong retail adoption and expanding ecosystem participation across markets.
- Lower transaction fees drive higher user activity, while Ethereum attracts larger institutional transfers despite recording fewer active stablecoin addresses overall.
- BNB price remains below major moving averages despite improving momentum, highlighting the gap between network growth and market performance.
BNB Chain has become the leading blockchain for stablecoin activity, recording about 15 million monthly active stablecoin addresses. Data from Binance Research and Dune shows the network has overtaken every major competitor in user participation. However, the milestone also highlights an important difference between user activity and capital concentration across blockchain ecosystems.
The latest figures show BNB Chain has expanded its stablecoin user base significantly since 2021. Its adoption has accelerated over the past several years, allowing the network to surpass Ethereum, Solana, and other leading blockchains in monthly active stablecoin addresses.
Stablecoins remain central to the digital asset market because they power trading, payments, cross-border transfers, and decentralized finance. Consequently, rising user activity often reflects stronger ecosystem engagement and broader network utility.
However, active addresses alone do not provide a complete picture of blockchain performance. While BNB Chain leads in user participation, other networks still attract larger institutional transactions and greater amounts of capital.
Also Read: Space and Time (SXT) Price Prediction 2026–2030: Can SXT Hit $0.05 Soon?
Retail activity drives BNB Chain’s leadership
We're back on X.
— 36Crypto (@36Crypto1) August 21, 2026
Our previous account (36crypto2) is currently unavailable while we continue working through the appeal process. In the meantime, this is our new official account. While you are on this page, please support us by sharing and following.
BNB Chain’s low transaction fees and accessible infrastructure have encouraged widespread retail participation. As a result, many users execute smaller transactions more frequently than they would on higher-cost networks. By comparison, Ethereum records fewer active stablecoin addresses but processes larger transfers from institutional investors and high-value participants. Therefore, lower address activity does not necessarily indicate weaker economic activity.
This distinction matters because blockchain adoption can be measured in different ways. Active users demonstrate network reach and utility. Meanwhile, transaction value, liquidity, and stablecoin market capitalization reveal where larger pools of capital remain concentrated.
Therefore, BNB Chain’s leadership reflects strong retail engagement rather than overall dominance across every stablecoin metric. BNB’s market performance has yet to mirror the network’s expanding user base. The cryptocurrency trades around $573 after spending several months establishing lower highs and lower lows.
Moreover, BNB remains below its 50-day, 100-day, and 200-day moving averages. This technical setup suggests buyers have not fully reversed the broader downtrend.
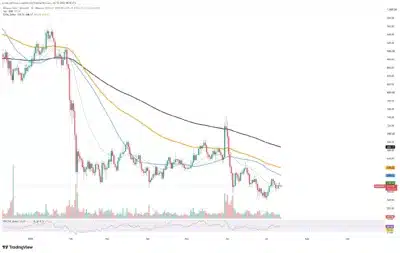
Source: Tradingview
Even so, momentum has improved modestly. The Relative Strength Index has recovered toward the neutral 50 level, indicating selling pressure has eased. Nevertheless, the 50-day exponential moving average near $579 remains the first major resistance level. Beyond that, the 100-day and 200-day moving averages present additional barriers that bulls must overcome.
Conclusion
BNB Chain’s growing stablecoin user base reinforces its position as the most active network by monthly addresses. However, the latest data also shows that high participation does not automatically translate into greater capital concentration, leaving investors to weigh strong adoption against BNB’s still-cautious technical outlook.
Also Read: Saylor warns BIP 110 sets dangerous precedent for Bitcoin governance
