


What to Know
- SXT has rebounded from its recent lows and broken above the Bollinger Band midpoint, signaling renewed buying momentum.
- RSI has climbed to 62, indicating bullish strength, though the token is approaching overbought territory.
- Long-term projections suggest SXT could target the $0.05 psychological level before 2030 if adoption and market conditions improve.
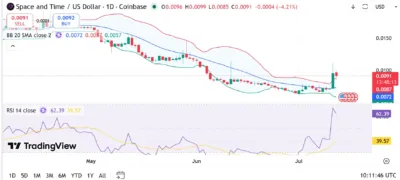
Space and Time (SXT) is showing its strongest recovery in weeks after breaking out from a prolonged downtrend that dominated much of May and June. The latest TradingView daily chart shows SXT trading around $0.0091, posting a strong rebound after bouncing from the lower Bollinger Band. Price has now moved above the 20-day Bollinger Band average near $0.0072, while the Relative Strength Index (RSI) has surged to 62.39, well above its RSI moving average of 39.57.
The sharp improvement in RSI suggests buyers have regained control following weeks of sustained selling pressure. Although price remains below the upper Bollinger Band at $0.0087, the breakout above the middle band signals improving momentum that could support additional upside if bulls maintain control.
Also Read: Opinion (OPINION) Price Prediction 2026–2030: Can OPINION Hit $0.10 Soon?
Recovery Strengthens After Months of Selling
SXT remained under persistent selling pressure throughout May and most of June, with every rally facing renewed resistance near the Bollinger Band midpoint. That weakness pushed the token steadily toward its lowest levels of the quarter.
The technical picture has changed during recent sessions. Buyers defended support near the lower Bollinger Band before triggering a strong breakout above the middle band. The latest bullish candle also briefly traded above $0.010, suggesting demand has returned after weeks of consolidation.
We're back on X.
— 36Crypto (@36Crypto1) August 21, 2026
Our previous account (36crypto2) is currently unavailable while we continue working through the appeal process. In the meantime, this is our new official account. While you are on this page, please support us by sharing and following.
Holding above the Bollinger midpoint would strengthen the short-term outlook and increase the chances of extending the recovery toward higher resistance levels.
Technical Analysis
The technical indicators continue to improve. SXT currently trades above the 20-day Bollinger Band average at $0.0072, while the RSI reading of 62.39 confirms growing bullish momentum. Although the RSI is approaching overbought territory, it still leaves room for additional gains before extreme conditions develop.
Immediate resistance now sits around $0.0100-$0.0110, where sellers recently appeared. A successful breakout above this zone could open the door toward $0.0125 and potentially $0.0150 over the medium term.
On the downside, the first support lies near the Bollinger midpoint around $0.0072, followed by stronger support near $0.0057, which aligns with the lower Bollinger Band. Losing these levels would weaken the current recovery and could shift momentum back in favor of sellers.
Source: Tradingview
Space and Time (SXT) Price Predictions (2026–2030)
| Year | Minimum Price | Average Price | Maximum Price |
|---|---|---|---|
| 2026 | $0.0085 | $0.0110 | $0.0150 |
| 2027 | $0.0110 | $0.0160 | $0.0220 |
| 2028 | $0.0150 | $0.0220 | $0.0300 |
| 2029 | $0.0200 | $0.0310 | $0.0400 |
| 2030 | $0.0280 | $0.0400 | $0.0500 |
Yearly Insights
2026
SXT could extend its recovery if buyers maintain support above the Bollinger midpoint and reclaim the $0.010 resistance area.
2027
Improving ecosystem adoption and stronger market sentiment could help the token challenge the $0.02 level.
2028
Growing blockchain infrastructure demand and sustained buying activity may support a move toward $0.03.
2029
A continued bullish crypto cycle could allow SXT to establish a stronger long-term uptrend and approach $0.04.
2030
If ecosystem growth accelerates alongside favorable market conditions, SXT could test the important $0.05 psychological level.
Conclusion
Space and Time has produced its strongest technical recovery in several weeks after breaking above the Bollinger Band midpoint and pushing RSI above 60. The improvement suggests bullish momentum is strengthening as buyers regain confidence.
The next key challenge lies between $0.010 and $0.011. A decisive breakout above that resistance would reinforce the current recovery and improve the outlook for higher price targets. Until then, traders should watch whether SXT can maintain support above the Bollinger midpoint while momentum continues to build.
FAQs
1. Is SXT showing bullish momentum?
Yes. The RSI has climbed to 62.39, while price has moved above the Bollinger Band midpoint, indicating improving bullish momentum.
2. What is the next resistance level?
The immediate resistance sits between $0.010 and $0.011, followed by $0.0125.
3. Where is the strongest support?
Initial support lies near $0.0072, with stronger support around $0.0057.
4. What does the RSI indicate?
An RSI reading of 62.39 shows buyers currently have momentum, although the token is approaching overbought conditions.
5. Can SXT reach $0.05?
If adoption continues to expand and the broader cryptocurrency market remains supportive, SXT could potentially challenge $0.05 by 2030.
Also Read: Cross (CROSS) Price Prediction 2026–2030: Can CROSS Hit $0.20 Soon?
