

What to Know
- FAN remains below the 20-day Bollinger Band average, indicating sellers still control the broader trend despite recent price stabilization.
- The RSI has fallen toward oversold territory, suggesting bearish momentum remains dominant while increasing the possibility of a technical rebound.
- Reclaiming the middle Bollinger Band could improve sentiment and support a gradual recovery toward the $0.100 psychological resistance level.
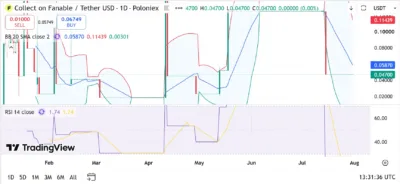
Collect on Fanable (FAN) continues trading under heavy selling pressure as the token struggles to recover above key technical resistance on the daily chart. TradingView data shows FAN changing hands around $0.0470, well below the 20-day Bollinger Band average at $0.0587, while the upper Bollinger Band stands near $0.1144. At the same time, the Relative Strength Index (RSI) has dropped to approximately 1.74, reflecting extremely weak buying momentum following an extended decline.
The latest correction has pushed the token toward the lower end of its recent trading range after repeated rejections near the upper Bollinger Band. Although volatility remains elevated, buyers must reclaim important technical levels before any sustained recovery can develop.
Also Read: Anoma (ANOMA) Price Prediction 2026–2030: Can ANOMA Hit $0.020 Soon?
Bears Maintain Control Below Resistance
FAN has experienced sharp price swings throughout recent months, repeatedly touching the upper Bollinger Band before reversing lower. The latest decline has dragged the token beneath the Bollinger Band midpoint, confirming that sellers currently retain control of the medium-term trend.
The 20-day moving average sits around $0.0587, creating the first major resistance level that bulls must overcome. Meanwhile, the upper Bollinger Band near $0.1144 represents the next significant upside barrier should buying momentum return. On the downside, price is hovering close to the lower Bollinger Band near $0.0030, highlighting elevated volatility and the risk of continued weakness if demand fails to improve.
Technical Outlook
We're back on X.
— 36Crypto (@36Crypto1) August 21, 2026
Our previous account (36crypto2) is currently unavailable while we continue working through the appeal process. In the meantime, this is our new official account. While you are on this page, please support us by sharing and following.
The RSI currently reads around 1.74, placing the indicator deep inside oversold territory. While such an unusually low reading reflects extremely weak momentum, it also suggests that selling pressure may be approaching exhaustion, creating conditions where bargain buyers could eventually attempt a recovery.
However, technical confirmation remains necessary before sentiment shifts decisively bullish. A recovery above the 20-day Bollinger Band average at $0.0587 would represent the first indication that buyers are regaining control. If that level is reclaimed, FAN could attempt a move toward $0.0800 before challenging the $0.100–$0.1144 resistance zone. Failure to hold current support would leave the token vulnerable to additional downside volatility.
FAN Price Prediction (2026–2030)
| Year | Minimum | Average | Maximum |
|---|---|---|---|
| 2026 | $0.0350 | $0.0500 | $0.0700 |
| 2027 | $0.0450 | $0.0650 | $0.1000 |
| 2028 | $0.0600 | $0.0850 | $0.1250 |
| 2029 | $0.0750 | $0.1050 | $0.1450 |
| 2030 | $0.0900 | $0.1300 | $0.1800 |
Price Forecast by Year
2026
FAN could stabilize between $0.0500 and $0.0700 if buyers successfully defend current support and gradually reclaim the 20-day moving average.
2027
Improving market sentiment and stronger trading activity could allow the token to challenge the important $0.100 psychological resistance level.
2028
A broader cryptocurrency recovery alongside increased ecosystem activity may support an advance toward $0.1250, provided bullish momentum continues strengthening.
2029
Continued accumulation and sustained demand could lift FAN toward $0.1450, reinforcing a longer-term recovery trend.
2030
If adoption expands and the broader digital asset market remains supportive, FAN could extend its rally toward $0.1800, representing the bullish scenario for this forecast.
Conclusion
FAN remains under bearish pressure as price trades below the 20-day Bollinger Band average while the RSI reflects extremely oversold conditions. Although momentum currently favors sellers, oversold readings often precede periods of stabilization when buying interest begins returning.
Reclaiming $0.0587 will be essential for improving the technical outlook. A sustained move above that level could strengthen bullish momentum and gradually increase the probability of FAN challenging the $0.100 resistance level during the coming years.
FAQs
1. Is FAN currently bullish?
No. FAN remains below its 20-day Bollinger Band average, indicating sellers continue controlling the prevailing trend.
2. What does the RSI indicate?
The RSI around 1.74 signals extremely oversold conditions, suggesting bearish momentum remains strong while also increasing the possibility of a technical rebound.
3. What are the major resistance levels?
The first important resistance sits near $0.0587, followed by the upper Bollinger Band around $0.1144.
4. Can FAN reach $0.100?
If buyers reclaim the middle Bollinger Band and broader cryptocurrency market conditions improve, FAN could approach $0.100 during the 2027–2028 period.
5. What risks could limit FAN’s upside?
Continued selling pressure, failure to recover above $0.0587, weak trading activity, and broader cryptocurrency market weakness could delay the token’s long-term recovery.
Also Read: BEAT Price Prediction 2026–2030: Can BEAT Hit $10 Soon?
