

What to Know
- DASH trades above every major daily EMA, maintaining a bullish structure while buyers defend the critical $52.77 support level firmly.
- Weekly RSI stands at 59.58, showing positive momentum without placing DASH in overbought territory or indicating immediate buyer exhaustion risks.
- Clearing $60.46 could support advances toward $70 and $88, while losing $52.77 may expose the lower $45.64 support level next.
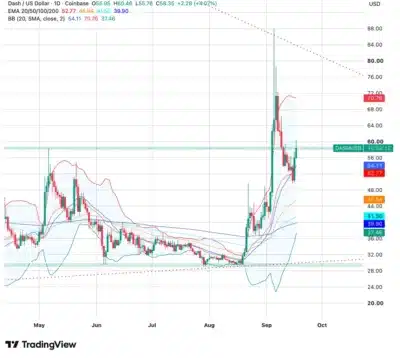
Dash (DASH) has strengthened its technical structure, gaining 10% over the week as buyers pushed the cryptocurrency toward the resistance range that restricted its price between January and August. DASH trades near $58.35, having opened the week at $53.03 before reaching $60.46.
Price remains above the 20-day EMA at $52.77, while the 50-day, 100-day and 200-day averages stand at $45.64, $41.50 and $39.90, respectively. Their bullish alignment indicates that short-term momentum is supported by a broader improvement in market structure.
Meanwhile, the Bollinger Band midpoint sits at $54.11, with the upper band positioned around $70.76. This arrangement leaves room for further appreciation, although buyers must first overcome $60.46 and the descending resistance line extending from September’s $88 peak.
Also Read: Pieverse Price Prediction 2026–2030: Can PIEVERSE Hit $12 Soon?
Buyers Defend the Former Trading Range
DASH’s recovery toward $58–$60 carries technical importance because this area prevented meaningful advances for much of 2026. Holding the former resistance zone as support would confirm that buyers retain control despite the correction from approximately $88.
We're back on X.
— 36Crypto (@36Crypto1) August 21, 2026
Our previous account (36crypto2) is currently unavailable while we continue working through the appeal process. In the meantime, this is our new official account. While you are on this page, please support us by sharing and following.
The 20-day EMA at $52.77 remains the most important short-term support because it has contained the latest pullback. Consequently, sustained trading above this level could encourage another challenge of $60.46 before buyers target the psychological $70 barrier.
However, losing $52.77 would weaken the developing recovery and expose the weekly low near $49.68. Additional selling could send DASH toward the 50-day EMA at $45.64, followed by the Bull Market Support Band between $40.65 and $42.63.
A decisive breakdown beneath that weekly band would damage the broader bullish structure and place the 200-day EMA at $39.90 under pressure.
Technical Outlook
Momentum currently favors DASH buyers, although resistance around $60.46 remains a significant obstacle. Weekly RSI stands at 59.58, comfortably above its moving average of 50.63 and below the overbought threshold of 70.
Furthermore, the 20-week SMA at $40.65 and 21-week EMA at $42.63 remain well beneath the market price. Their position indicates that the wider trend turned bullish before the latest weekly advance, rather than depending entirely on the recent 10% gain.
Bollinger Bands have widened considerably because of September’s volatility, suggesting larger price movements could persist. A convincing breakout above $60.46 may open the way toward $70.76, although descending trendline resistance around $76–$80 would present another challenge.
Source: Tradingview
DASH Price Prediction (2026–2030)
| Year | Minimum | Average | Maximum |
|---|---|---|---|
| 2026 | $39 | $65 | $100 |
| 2027 | $52 | $88 | $135 |
| 2028 | $68 | $115 | $175 |
| 2029 | $90 | $155 | $240 |
| 2030 | $120 | $210 | $320 |
Price Forecast by Year
2026
DASH could trade between $39 and $100 during 2026, depending on whether buyers protect the 20-day EMA at $52.77. A breakout above $60.46 could support advances toward $70 and the September peak near $88.
Nevertheless, losing $45.64 would weaken the outlook and expose the broader support area between $39.90 and $42.63.
2027
Growing demand could help DASH average approximately $88 in 2027, with a bullish maximum near $135. The cryptocurrency would need to convert $70 and $88 into dependable support levels before pursuing the upper projection.
2028
Under favorable market conditions, DASH could trade between $68 and $175 during 2028. Greater adoption, sustained demand for privacy-focused cryptocurrencies and consistently higher yearly lows would support the maximum target.
2029
DASH could advance toward $240 if buyers preserve the long-term bullish structure and defend earlier breakout zones. Conversely, reduced market demand may keep the asset closer to its projected $90 minimum.
2030
A sustained bullish cycle could place DASH near $320 by 2030, while the average forecast stands around $210. Reaching these levels would require broader cryptocurrency market expansion and successful breaks above previous cycle highs.
Key Resistance and Support Levels
Immediate resistance stands at $60.46, matching the weekly high that rejected the latest advance. A daily close above this barrier would strengthen the recovery and bring $70 into consideration.
Clearing $70 and the upper Bollinger Band at $70.76 could support a move toward the descending trendline around $76–$80. Beyond that area, the September peak near $88 represents the next major resistance before DASH can challenge $100.
Conversely, $52.77 remains the primary support because it aligns with the rising 20-day EMA. Lower levels include $49.68, $45.64 and the weekly support band between $40.65 and $42.63.
Why Is DASH Rallying?
DASH’s rally combines a technical breakout with renewed attention toward one of the cryptocurrency market’s oldest privacy-focused projects. The cryptocurrency has survived multiple cycles while retaining several features designed to support fast payments, network governance and transaction privacy.
Masternodes help power Dash governance, ChainLocks and the Dash Evolution ecosystem, while InstantSend enables rapid, inexpensive payments. PrivateSend provides optional transaction mixing, whereas ChainLocks strengthens network protection against potential mining attacks.
Trader Sjuul of AltCryptoGems reported that DASH had gained more than 80% over a trailing monthly period, reflecting growing interest in the project. The analyst also highlighted transaction settlement of approximately one second, fees below one cent and more than 159,000 accepting merchants and services, although the adoption figure represents the source’s count.
Can DASH Reach $100?
DASH could reach $100 if buyers preserve $52.77, break above $60.46 and convert the $70–$88 region into support. Such a move would require an advance of approximately 71% from the referenced price of $58.35.
The projection is technically possible because every major daily EMA sits below price, while weekly RSI remains below overbought territory. However, rejection near $60.46 or the descending trendline could delay the target, whereas a breakdown below $45.64 would substantially weaken the bullish case.
Conclusion
DASH maintains a bullish technical structure as its price trades above the major daily averages and weekly Bull Market Support Band. The weekly RSI reading of 59.58 also indicates strengthening momentum without signaling excessive market conditions.
A confirmed breakout above $60.46 could support advances toward $70, $76–$80 and $88, placing the psychological $100 target within reach. However, losing $52.77 would expose $49.68 and $45.64, while deeper selling could return DASH toward $40.65.
FAQs
1. Is DASH currently bullish?
DASH has a bullish technical structure because its price remains above every major daily EMA and the weekly Bull Market Support Band.
2. What does DASH’s weekly RSI indicate?
The weekly RSI at 59.58 shows positive momentum without placing DASH in overbought territory or signaling immediate exhaustion.
3. What are DASH’s major resistance levels?
Immediate resistance stands at $60.46, followed by $70, the descending trendline around $76–$80 and the September peak near $88.
4. Can DASH reach $100?
DASH could reach $100 if buyers defend $52.77 and secure sustained breakouts above the important $60.46, $70 and $88 resistance levels.
5. What could weaken DASH’s price outlook?
A decline below $52.77 would weaken short-term momentum, while losses beneath $45.64 and $40.65 could damage the broader bullish structure.
Also Read: IOTA Price Prediction 2026–2030: Can IOTA Hit $0.10 Soon?
