


What to Know
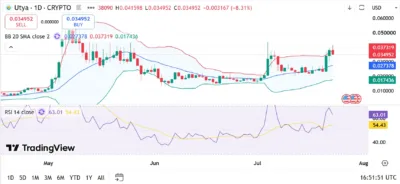
- UTYA closed at $0.034952, down 8.31%, as sellers pushed the token below its upper Bollinger Band following a recent advance.
- The RSI stands at 63.01, showing bullish momentum despite the pullback, while the middle Bollinger Band remains below price.
- Holding $0.027378 could support another attempt at $0.037319, whereas losing that level would weaken the chart’s recovery pattern.
Utya (UTYA) closed at $0.034952 on the supplied daily TradingView chart, falling 8.31% during a session that began at $0.038090 and reached a high of $0.041598. The close matched the session low, indicating that sellers retained control into the end of the candle.
The pullback followed a move above the upper Bollinger Band, which stands at $0.037319, but UTYA remains above the indicator’s middle band at $0.027378. Its 14-day Relative Strength Index (RSI) reads 63.01, leaving momentum above the neutral level of 50 without placing it in overbought territory.
Also Read: Phala Network Price Prediction 2026–2030: Can PHA Hit $0.10 Soon?
UTYA Pulls Back From Recent Highs
The chart shows UTYA climbing from a prolonged period of trading near $0.02 before challenging the $0.04 area. Buyers briefly pushed the token to $0.041598 in the latest session, although the retreat to $0.034952 shows that holding those gains has proved difficult.
A recovery above the upper Bollinger Band at $0.037319 would put $0.04 back within reach, followed by a retest of the session high. However, another rejection around those levels could keep UTYA between the upper band and its recent consolidation area.
Bollinger Bands Show Room for Volatility
We're back on X.
— 36Crypto (@36Crypto1) August 21, 2026
Our previous account (36crypto2) is currently unavailable while we continue working through the appeal process. In the meantime, this is our new official account. While you are on this page, please support us by sharing and following.
The middle Bollinger Band at $0.027378 is the clearest indicator level beneath the current price, while the lower band stands at $0.017436. UTYA’s position above the middle band supports the broader recovery shown on the chart, even as the latest candle signals short-term selling pressure.
If buyers defend $0.027378, UTYA could form a base for another attempt at $0.037319. A daily close below the middle band would weaken that outlook and make the lower end of the recent trading range more relevant.
RSI Remains Above Neutral
UTYA’s RSI has eased to 63.01 but remains above its moving average of 54.43, suggesting that the recent decline has yet to erase the chart’s positive momentum. The indicator is also below the conventional overbought threshold of 70.
A rebound in RSI alongside a move back above $0.037319 would strengthen the case for another price advance. Conversely, an RSI decline below 50, particularly alongside a loss of the middle Bollinger Band, would point to a more sustained correction.
Source; Tradingview
Utya (UTYA) Price Prediction 2026–2030
| Year | Minimum | Average | Maximum |
|---|---|---|---|
| 2026 | $0.017 | $0.035 | $0.055 |
| 2027 | $0.020 | $0.045 | $0.075 |
| 2028 | $0.025 | $0.060 | $0.100 |
| 2029 | $0.030 | $0.080 | $0.140 |
| 2030 | $0.035 | $0.100 | $0.200 |
Price Forecast by Year
2026
Holding above $0.027378 could allow UTYA to retest $0.037319 and $0.041598, with a stronger breakout opening a path toward the scenario maximum of $0.055. If sellers instead push the price through the middle Bollinger Band, a move toward the lower band at $0.017436 would become a greater risk.
2027
Sustained trading above the current chart’s $0.04 region could support a wider recovery and bring $0.075 into consideration under favorable conditions. Weak demand or limited liquidity could leave UTYA closer to the projected $0.020 minimum.
2028
UTYA could reach $0.10 in an optimistic scenario if successive advances establish higher support levels and attract consistent trading activity. The $0.060 average represents a more restrained outcome, while a weaker market could keep the token near $0.025.
2029
A continuation of that longer-term growth could place $0.14 within reach, although such an outcome would require more than the short-term momentum visible on one chart. Reduced participation or a broader market downturn could instead hold UTYA around the projected $0.030 minimum.
2030
The table’s $0.20 maximum would require an increase of approximately 472% from the displayed close of $0.034952, making it a highly bullish scenario rather than an expected result. Under more moderate conditions, UTYA could trade nearer the illustrative $0.10 average.
Conclusion
UTYA’s latest daily candle shows a substantial retreat from $0.041598, but the token remains above the middle Bollinger Band and its RSI remains above 50. Buyers need to reclaim $0.037319 to strengthen the immediate outlook, while a loss of $0.027378 would raise the risk of a deeper pullback.
Reaching $0.10 by 2030 is possible within the illustrative bullish scenarios, although the supplied chart alone cannot establish whether UTYA will sustain the demand and liquidity needed to get there.
FAQs
1. Is UTYA bullish on the supplied chart?
UTYA remains above its middle Bollinger Band, although the latest 8.31% daily decline shows that buyers have lost some short-term control.
2. What is UTYA’s immediate resistance?
The upper Bollinger Band at $0.037319 is the nearest indicator level to reclaim, followed by the $0.04 area and the session high of $0.041598.
3. What support level matters most for UTYA?
The middle Bollinger Band at $0.027378 is the main support level identified by the chart’s indicator.
4. Is UTYA’s RSI overbought?
No. The displayed RSI of 63.01 is below the conventional overbought threshold of 70.
5. Can UTYA reach $0.10 by 2030?
It could under a bullish long-term scenario, but that target depends on sustained demand and cannot be reliably predicted from the supplied chart alone.
Also Read: Litecoin Price Prediction 2026–2030: Can LTC Hit $100 Soon?
