


What to Know
- Beam trades at $0.002763, above its upper Bollinger Band, as a large bullish daily candle extends the token’s recent recovery.
- Immediate support stands at $0.002483, while the middle Bollinger Band at $0.001983 provides a lower reference if selling pressure increases.
- Reaching $0.005 requires approximately 81% appreciation, with longer-term price scenarios depending on sustained buying demand and broader cryptocurrency market conditions.
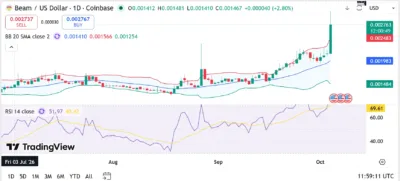
Beam trades at $0.002763 as a strong daily advance pushes its price above the upper Bollinger Band. According to the TradingView daily chart for Beam/USD on Coinbase, the latest price stands above the upper boundary at $0.002483, extending the recovery that developed through September.
The latest candle shows a substantial upward move, although its upper wick indicates selling below the session’s highest level. Buyers have lifted Beam beyond its recent trading range, placing breakout support and the next resistance levels at the center of the technical outlook.
Also Read: Aethir (ATH) Price Prediction 2026–2030: Can ATH Hit $0.01 Soon?
BEAM Breaks Above Its Recent Trading Range
Beam traded within a relatively narrow range through much of July and August before establishing a stronger upward trend during September. The recovery produced higher price levels, followed by a brief consolidation before the latest large green candle.
The displayed price of $0.002763 places the token above the recent consolidation area and its upper Bollinger Band. Maintaining this position would support the recovery, while a return beneath the breakout area would increase the possibility of a retracement.
We're back on X.
— 36Crypto (@36Crypto1) August 21, 2026
Our previous account (36crypto2) is currently unavailable while we continue working through the appeal process. In the meantime, this is our new official account. While you are on this page, please support us by sharing and following.
The round-number level of $0.003 provides the next reference for an upward move. A sustained advance beyond that level could bring $0.004 and $0.005 into consideration, although these represent potential targets rather than confirmed chart resistance.
Reaching $0.005 would require approximately 81% appreciation from $0.002763, making sustained buying demand necessary for that scenario.
Bollinger Bands Identify Key Support Levels
The right-edge Bollinger Band readings show an upper boundary of $0.002483, a middle band of $0.001983, and a lower boundary of $0.001484. Their widening separation reflects increasing price volatility as Beam’s recovery accelerates.
The upper band provides the nearest indicator-based support reference. Holding above $0.002483 would preserve the token’s position outside the band, while a decline beneath it would bring price back inside the indicator’s range.
A deeper pullback could bring the middle band at $0.001983 into consideration. This level sits approximately 28.2% below the displayed price and represents a more substantial retracement of the recent advance.
The lower boundary at $0.001484 provides a further downside reference if selling extends. These indicator levels will change as additional daily candles develop.
RSI Signals Strengthening Buying Momentum
The RSI line rises steeply at the right edge of the chart and extends above the visible 70 threshold, indicating elevated buying momentum. Its exact latest reading is not visible, although the direction supports the strength shown by the price breakout.
The yellow RSI moving average is labeled 69.61, placing the smoothed momentum reading near the conventional overbought threshold. An elevated RSI can persist during a strong advance, but it also increases the importance of monitoring whether buying pressure remains sufficient to sustain higher prices.
A continued price advance alongside strong RSI would support the bullish outlook. Conversely, weakening momentum combined with a move below $0.002483 would suggest that the breakout is losing strength.
Source: TradingView
Beam (BEAM) Price Prediction 2026–2030
| Year | Minimum scenario | Average scenario | Maximum scenario |
|---|---|---|---|
| 2026 | $0.0015 | $0.0028 | $0.0050 |
| 2027 | $0.0012 | $0.0035 | $0.0070 |
| 2028 | $0.0015 | $0.0045 | $0.0100 |
| 2029 | $0.0020 | $0.0060 | $0.0150 |
| 2030 | $0.0025 | $0.0080 | $0.0200 |
Price Forecast by Year
2026
Beam could approach the $0.0050 bullish scenario if buyers defend the breakout area and establish sustained trading above $0.003. The $0.0028 central scenario assumes consolidation near the displayed price, while a retreat toward the lower Bollinger Band would align with the $0.0015 bearish scenario.
2027
The $0.0070 bullish scenario would require Beam to build on its recovery and establish a higher trading range beyond $0.005. More moderate demand could support the $0.0035 central scenario, whereas persistent selling and unsuccessful recovery attempts could push price toward $0.0012.
2028
Sustained demand and favorable market conditions could support the $0.0100 bullish scenario. The $0.0045 central scenario represents a slower advance, while an extended downturn could leave Beam near the $0.0015 bearish scenario.
2029
The $0.0150 bullish scenario assumes substantial expansion in Beam’s trading range over several years. A more restrained recovery could place price around $0.0060, while weaker demand and broader market declines could bring the $0.0020 bearish scenario into consideration.
2030
The $0.0200 bullish scenario represents approximately 7.2 times the displayed price and would require substantial, sustained appreciation. The central scenario stands at $0.0080, while the $0.0025 bearish scenario places Beam slightly below its current chart price.
Conclusion
Beam’s daily chart shows an accelerating recovery, with price at $0.002763 above the upper Bollinger Band at $0.002483. The rising RSI supports strong buying momentum, although the latest candle’s upper wick leaves room for consolidation or a pullback.
Holding the breakout area could support an attempt at $0.003, followed by the conditional targets of $0.004 and $0.005. A decline below $0.002483 would bring the middle Bollinger Band at $0.001983 into consideration.
FAQs
1. Is BEAM bullish on the daily chart?
Beam shows bullish momentum through its rising price structure and position above the upper Bollinger Band, although the advance remains vulnerable to a pullback.
2. What is BEAM’s next upside level?
The round-number level of $0.003 provides the next upside reference, followed by the conditional targets of $0.004 and $0.005.
3. Which support levels matter for BEAM?
The upper Bollinger Band at $0.002483 provides the nearest reference, followed by the middle band at $0.001983 and lower band at $0.001484.
4. Is BEAM’s RSI overbought?
The latest RSI line extends above the visible 70 threshold, indicating overbought conditions, although its exact current reading is not visible.
5. Can BEAM reach $0.005?
A move to $0.005 would require approximately 81% appreciation from $0.002763, supported by sustained buying pressure and further progress beyond $0.003.
Also Read: Utya (UTYA) Price Prediction 2026–2030: Can UTYA Hit $0.10 Soon?
