

What to Know
- Hydration trades near $0.0070590 below its Bollinger Band midline, with recent declining candles showing persistent selling pressure following August’s rally.
- HDX’s RSI stands at 35.48, indicating weak momentum, while its position above oversold territory leaves room for further price declines.
- Recovering above $0.0083881 could support a challenge of $0.01, while losing $0.0061559 would weaken the token’s prospects for sustained recovery.
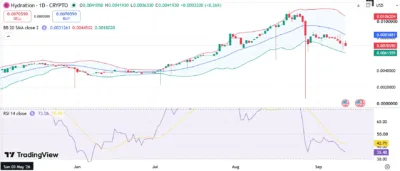
Hydration (HDX) trades near $0.0070590, with its daily chart showing a weakening price structure following a substantial rally into late August. According to the supplied TradingView chart, the token remains below its 20-day Bollinger Band average at $0.0083881 and above the lower band at $0.0061559.
The recent candles show sellers maintaining control as HDX retreats from the $0.008 region toward lower support. Unlike the earlier advance, which carried prices above $0.01, the latest movement features weaker rebounds and renewed downward pressure.
The Relative Strength Index stands at 35.48, below its moving average at 42.71 and the neutral threshold of 50. These readings suggest buying strength remains limited, although the indicator has not crossed below the conventional oversold threshold of 30. HDX is Hydration’s native token, providing access to governance and supporting participation in the protocol’s incentive system.
Also Read: Useless Coin (USELESS) Price Prediction 2026–2030: Can USELESS Hit $0.10 Soon?
Market Structure and Price Action
Hydration’s chart shows a consolidation phase around $0.004 during June, followed by a sustained advance through July and August. Buyers pushed the token above $0.01 before a substantial reversal interrupted the upward trend.
We're back on X.
— 36Crypto (@36Crypto1) August 21, 2026
Our previous account (36crypto2) is currently unavailable while we continue working through the appeal process. In the meantime, this is our new official account. While you are on this page, please support us by sharing and following.
The subsequent decline carried HDX below the Bollinger Band midline, followed by a brief recovery toward $0.008. Buyers failed to sustain that rebound, and the latest candles show the price moving lower again.
The lower Bollinger Band at approximately $0.0061559 forms the nearest indicator-based support reference. Holding that region could allow consolidation, while a sustained breakdown would increase the risk of a deeper correction toward the earlier trading area around $0.004.
A stronger recovery would require HDX to reclaim $0.0083881. Moving above that level and holding it through subsequent sessions would improve the technical structure and bring the psychological $0.01 barrier back into contention.
Technical Analysis
| Indicator | Value |
|---|---|
| Upper Bollinger Band | $0.0106204 |
| Middle Band — 20-day SMA | $0.0083881 |
| Lower Bollinger Band | $0.0061559 |
| Displayed price | $0.0070590 |
| RSI | 35.48 |
| RSI moving average | 42.71 |
Bollinger Bands Show a Weaker Trend
HDX trades in the lower half of its Bollinger channel, indicating weakness relative to its recent average price. The midline slopes downward at the right edge of the chart, reinforcing the deterioration in the short-term trend.
Recovering the $0.0083881 midline would represent an initial improvement. Buyers would then face $0.01, followed by the upper band at $0.0106204, which sits approximately 50% above the displayed price. Bollinger Bands adjust as new candles form, so these levels serve as current technical references rather than fixed future targets.
RSI Reflects Persistent Selling Pressure
The RSI reading of 35.48 indicates bearish momentum without confirming an oversold condition. Its position below the 42.71 moving average also shows that recent momentum remains weaker than its smoothed trend.
An RSI recovery above its moving average would suggest improving strength, while a move beyond 50 would provide stronger support for a bullish recovery. Further deterioration toward 30 would indicate increasing downward momentum.
Source: TradingView
HDX Price Predictions (2026–2030)
| Year | Minimum Price Scenario | Average Price Scenario | Maximum Price Scenario |
|---|---|---|---|
| 2026 | $0.0040 | $0.0075 | $0.0106 |
| 2027 | $0.0045 | $0.0090 | $0.0140 |
| 2028 | $0.0050 | $0.0110 | $0.0180 |
| 2029 | $0.0060 | $0.0140 | $0.0230 |
| 2030 | $0.0070 | $0.0170 | $0.0300 |
Yearly Insights
2026
HDX’s remaining 2026 outlook centers on defending the $0.0062 region and reclaiming the Bollinger midline near $0.0084. A successful recovery could support another test of $0.01–$0.0106, while sustained weakness could expose the earlier $0.004 trading area.
2027
Stronger demand and improving liquidity could support a recovery toward $0.014 under favorable conditions. Establishing support above $0.01 would help strengthen this scenario, although renewed market weakness could keep prices below that threshold.
2028
A sustained cryptocurrency market expansion could allow HDX to challenge $0.018. Reaching this level would require buyers to overcome the visible August peak and maintain demand beyond the initial breakout.
2029
The bullish scenario places HDX near $0.023 if adoption translates into stronger token demand. Weak liquidity or limited buying interest could instead produce prolonged consolidation at substantially lower levels.
2030
A favorable long-term scenario allows for a move toward $0.03, supported by sustained demand and broader market strength. The supplied daily chart establishes no timetable or technical confirmation for that outcome.
Conclusion
Hydration remains under bearish pressure, with its price below the Bollinger Band midline and RSI at 35.48. The recent candles show a declining short-term structure, making support near $0.0061559 an important reference for the next move.
Reclaiming $0.0083881 would improve the recovery outlook and could support a challenge of $0.01, approximately 42% above the displayed price. A sustained move above that psychological barrier would bring the upper Bollinger Band near $0.0106204 into view.
FAQs
1. What is the immediate support level for HDX?
The nearest indicator-based support is approximately $0.0061559, corresponding to the lower Bollinger Band on the supplied chart.
2. What is the next major resistance for HDX?
The Bollinger Band midline at $0.0083881 is the first recovery hurdle, followed by $0.01 and the upper band at $0.0106204.
3. What does HDX’s RSI indicate?
The RSI reading of 35.48 indicates bearish momentum. It remains below neutral but above the conventional oversold threshold of 30.
4. Can HDX reach $0.01 before 2030?
The chart shows HDX previously traded above $0.01. Reclaiming that level is possible, although the current indicators do not confirm a recovery or its timing.
5. Why is the Bollinger Band midline important?
The midline represents the 20-day average price. Recovering and holding above it would indicate improving price strength relative to recent trading.
Also Read: Bitcoin (BTC) Price Prediction 2026–2030: Can BTC Hit $67,000 Before August?
