


What to Know
- CRED trades near CAD 19.90, reflecting sustained downward pressure as the ETF struggles to recover from its earlier price highs.
- Bollinger Bands indicate bearish momentum, with CRED trading below its middle band while approaching the lower boundary near CAD 19.88.
- The RSI stands near 34.66, indicating weakening buying momentum, while recovery prospects depend on reclaiming resistance around CAD 20.05.
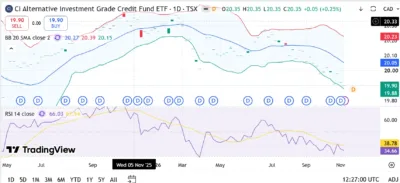
CI Alternative Investment Grade Credit Fund ETF (CRED) trades near CAD 19.90, reflecting persistent selling pressure as the fund struggles to recover from its earlier highs. According to the TradingView daily chart, CRED remains below its middle Bollinger Band near CAD 20.05, indicating that bearish momentum continues to influence its price structure.
The ETF has gradually declined from levels above CAD 20.30, with recent trading activity bringing prices toward the lower Bollinger Band at CAD 19.88. Meanwhile, the Relative Strength Index (RSI) stands at 34.66, below its moving average of 38.78, suggesting that selling pressure remains dominant despite the possibility of a technical recovery.
Also Read: Civic (CVC) Price Prediction 2026–2030: Can CVC Hit $1 Soon?
Market Structure and Price Action
CRED experienced relatively stable trading conditions during the middle of 2025, with prices fluctuating around CAD 20.00 before gradually strengthening toward the final quarter. Buyers maintained sufficient demand to support a steady recovery, eventually pushing the ETF above CAD 20.20.
October and November 2025 brought stronger upward movement, with CRED challenging the CAD 20.30 region before entering a period of consolidation. Although occasional pullbacks emerged, the broader structure remained relatively stable as buyers defended higher price levels.
We're back on X.
— 36Crypto (@36Crypto1) August 21, 2026
Our previous account (36crypto2) is currently unavailable while we continue working through the appeal process. In the meantime, this is our new official account. While you are on this page, please support us by sharing and following.
Early 2026 introduced renewed volatility as CRED struggled to maintain its previous gains. Prices briefly approached the CAD 20.30 region before weakening considerably during March, eventually declining toward CAD 20.00.
April and May recorded additional fluctuations, with recovery attempts failing to establish sustained upward momentum. The ETF subsequently rebounded during June and July, briefly challenging the CAD 20.20 region before sellers regained control.
September and October brought further weakness as CRED gradually slipped below CAD 20.10 and eventually approached CAD 20.00. The decline extended into November, leaving the ETF trading near CAD 19.90.
Immediate support stands around CAD 19.88, followed by CAD 19.80 and CAD 19.70. Conversely, reclaiming CAD 20.05 could support a recovery toward CAD 20.15 and CAD 20.23, although stronger buying participation would be necessary to establish a sustained bullish reversal.
Bollinger Bands Indicate Persistent Bearish Momentum
CRED trades below its middle Bollinger Band at CAD 20.05, indicating it remains under downward pressure following its prolonged decline. The lower band stands near CAD 19.88, while the upper boundary sits around CAD 20.23.
The ETF’s proximity to the lower boundary suggests that prices are approaching an important technical support region. A sustained decline beneath CAD 19.88 could strengthen bearish expectations, potentially exposing CAD 19.80 and eventually CAD 19.70.
Meanwhile, reclaiming the middle Bollinger Band at CAD 20.05 would represent an early indication of improving momentum. Additional buying could subsequently support appreciation toward CAD 20.15 and CAD 20.23.
The distance between the upper and lower bands indicates a relatively contained trading range compared with highly volatile cryptocurrency assets. Nevertheless, further expansion could accompany stronger directional movement.
Reaching CAD 20.23 from CAD 19.90 would require approximately 1.66% appreciation, while reaching CAD 25 would demand roughly 25.63% growth. Such an advance would require a substantial change in the ETF’s prevailing price structure and favorable underlying credit market conditions.
RSI Signals Weakening Momentum as Selling Pressure Persists
The RSI reading of 34.66 remains below the neutral threshold of 50, indicating that bearish momentum continues to dominate CRED’s recent trading activity. Its position beneath the moving average of 38.78 further suggests that buyers have struggled to reverse the prevailing decline.
During late 2025, the indicator frequently approached elevated levels as CRED strengthened toward CAD 20.30. However, the momentum structure weakened during early 2026 as the ETF experienced repeated selling pressure.
March brought a substantial deterioration in momentum, with the RSI briefly approaching oversold territory before recovering during subsequent trading sessions. Although June introduced a temporary improvement, the indicator gradually weakened throughout August, September, and October as prices declined toward CAD 20.00.
Maintaining an RSI above 30 could support stabilization, while a recovery beyond 40 would provide an early indication of improving buying activity. Conversely, a sustained decline beneath 30 could signal stronger bearish momentum, potentially exposing CRED to additional downside.
CRED Price Predictions (2026–2030)
| Year | Minimum Price | Average Price | Maximum Price |
|---|---|---|---|
| 2026 | CAD 19.50 | CAD 20.00 | CAD 20.40 |
| 2027 | CAD 19.00 | CAD 20.30 | CAD 21.20 |
| 2028 | CAD 18.80 | CAD 20.70 | CAD 22.00 |
| 2029 | CAD 18.50 | CAD 21.20 | CAD 23.00 |
| 2030 | CAD 18.00 | CAD 21.80 | CAD 24.00 |
Yearly Insights
2026
CRED’s remaining 2026 outlook depends on defending support around CAD 19.88 and recovering above resistance at CAD 20.05. Stronger buying could support appreciation toward CAD 20.40, while sustained selling pressure might expose the CAD 19.50 region if the prevailing bearish structure persists.
2027
Improving credit market conditions and stabilizing interest rates could support a recovery toward CAD 21.20, provided the ETF establishes stronger upward momentum. Nevertheless, widening credit spreads or unfavorable bond market conditions could restrict CRED toward the projected CAD 19.00 minimum.
2028
Favorable fixed income market conditions could allow CRED to challenge CAD 22.00, particularly if portfolio valuations benefit from declining yields and improving credit demand. Conversely, prolonged market uncertainty and weaker credit performance could bring prices toward CAD 18.80.
2029
Sustained investor demand and supportive credit market conditions could strengthen CRED’s long-term outlook, potentially allowing the ETF to approach CAD 23.00. Nevertheless, elevated borrowing costs, credit deterioration, or unfavorable interest rate movements could limit appreciation and expose the projected CAD 18.50 minimum.
2030
A favorable long-term scenario places CRED near CAD 24.00, assuming supportive market conditions and sustained improvements in underlying credit valuations. Reaching CAD 25 would require appreciation beyond this projected maximum, making the milestone speculative without substantial changes in the fund’s valuation environment.
Importantly, distributions can affect an ETF’s market price, meaning long-term investment performance should also be evaluated using total returns rather than price appreciation alone.
Conclusion
CRED remains under bearish pressure near CAD 19.90, with its position below the middle Bollinger Band at CAD 20.05 indicating continued weakness. The RSI reading of 34.66 reinforces the bearish outlook, although its proximity to oversold territory suggests that a technical recovery remains possible.
Reclaiming CAD 20.05 could support appreciation toward CAD 20.15 and CAD 20.23, while losing CAD 19.88 might expose further downside toward CAD 19.80. The CAD 25 target remains speculative and depends on favorable credit market conditions, interest rate developments, and sustained improvements in underlying portfolio valuations.
FAQs
1. What is the immediate support level for CRED?
Immediate support stands near CAD 19.88, followed by the CAD 19.80 and CAD 19.70 price regions.
2. What is the next major resistance for CRED?
CRED faces immediate resistance at CAD 20.05, followed by CAD 20.15 and the upper Bollinger Band near CAD 20.23.
3. What does CRED’s RSI indicate?
The RSI reading of 34.66 indicates bearish momentum, although its proximity to the conventional oversold threshold of 30 suggests that selling pressure may be approaching an important technical level.
4. Can CRED reach CAD 25 before 2030?
Reaching CAD 25 would require approximately 25.63% appreciation from CAD 19.90. While mathematically possible, the target remains speculative given the ETF’s current technical structure and the characteristics of its underlying credit investments.
5. Why is the Bollinger Band midline important?
The CAD 20.05 midline represents the 20-day moving average, helping identify the underlying price trend and potential resistance during recovery attempts. CRED’s position below this level indicates that bearish momentum remains dominant.
Also Read: IDOL (IDOL) Price Prediction 2026–2030: Can IDOL Hit $1 Soon?
