Aave (AAVE), a leading decentralized finance (DeFi) platform, has gained immense traction since its rebranding from ETHLend in 2018. The protocol allows users to lend and borrow cryptocurrencies, earning interest on deposits or accessing flash loans with collateral.
Over the years, Aave has introduced numerous enhancements to its platform, solidifying its position in the DeFi space. With its utility and governance features, AAVE tokens offer holders discounted fees and influence over the platform’s future developments.
As Aave continues to evolve, the token’s price trajectory remains a critical point of interest for traders and investors.
Also Read: Bonk (BONK) Price Prediction 2025-2028: Will BONK Price Hit $0.000094 Soon?
Technical Analysis of Aave (AAVE)
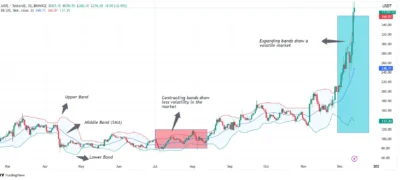
Bollinger Bands Analysis
Aave’s recent price movements show high volatility, with the token frequently reaching its upper trading limit before pulling back to the mid or lower bands during market adjustments.
Intermittent price volatility becomes likely when market bands stretch out. While AAVE remains strong, it could temporarily reverse its path to approach the middle band before resuming its current uptrend.

Source: Tradingview
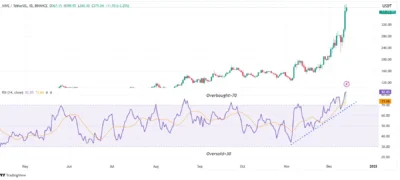
Relative Strength Index (RSI)
The RSI for Aave reads at 82, placing it firmly in the overbought zone, indicating increased buying activity that has pushed the price higher. Aave’s price gain appears to have peaked as the RSI indicator shows less upward momentum, suggesting we may enter a market price adjustment period for the RSI to drop beneath the signal line because this action signals the end of the current price increase.
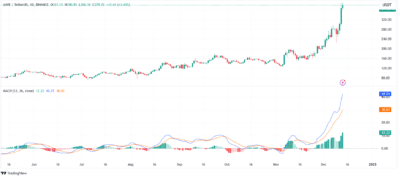
Moving Average Convergence and Divergence (MACD)
At 42.19, Aave’s current MACD measure indicates robust market growth, while the high green bars on the histogram demonstrate superior trading results compared to earlier market activity. The MACD indicator shows the line moves further away from its signal line, which validates the market’s uptrend pattern.
Also Read: Hedera (HBAR) Price Prediction 2025-2029: Will HBAR Surge Beyond $0.95 Soon?

Source: Tradingview
Aave (AAVE) Price Predictions 2025-2029
| Year | Minimum Price ($) | Average Price ($) | Maximum Price ($) |
| 2025 | 500 | 650 | 800 |
| 2026 | 450 | 550 | 650 |
| 2027 | 650 | 690 | 850 |
| 2028 | 700 | 750 | 1,000 |
| 2029 | 880 | 1,200 | 1,350 |
Price Prediction for the 2025-2028
2025
Aave’s path to growth will gain traction in 2025, driven by a positive market stance, potentially exceeding $430 resistance levels and reaching a maximum value of $800. The Aave market faces brief pullback opportunities that could push the Price to near $500.
2026
The crypto market could face downward price trends in 2026 when it undergoes its regular market slowdown. The token will experience decreased market strength and reach $450 during this phase, with its future value stabilizing around $550 as it finds equilibrium.
2027
In 2027, the crypto market should start showing signs of recovery as investors return to buying Aave. The token is expected to trade between $690 and increase to $850 during this period, as Aave is to enter its most profitable upward movement at this initial stage.
2028
Aave Altcoin expects significant market growth when Bitcoin undergoes the halving process in 2028. If crypto users increase their attention, the token could rise to $1,000, but despite ongoing stability, the Price might fall to $700 during market spikes.
2029
Following Bitcoin’s halving event in 2029, the crypto market rally will likely push Aave up to higher levels again. Aave might achieve its highest prices yet, between $880 and $1,350, throughout 2029, driven by stronger adoption of decentralized financial tools.
Conclusion
Aave (AAVE) remains a key player in the DeFi ecosystem, offering innovative solutions for lending and borrowing cryptocurrencies. Its price trajectory from 2025 to 2029 reflects the potential for significant growth fueled by bullish market sentiment, technical developments, and increased adoption.
While periods of correction are inevitable, Aave’s robust fundamentals and strong community support make it a promising investment in the long term.
FAQs
What is Aave (AAVE)?
Aave is a decentralized finance platform that enables users to lend, borrow, and earn interest on cryptocurrency deposits.
Why is Aave’s RSI significant?
Aave’s RSI indicates whether the token is overbought or oversold, helping traders gauge potential market reversals.
What does the MACD reveal about Aave’s price movement?
The MACD shows Aave’s bullish momentum, with positive readings indicating strong performance compared to recent trading days.
What is the projected maximum Price for Aave in 2029?
Aave’s maximum Price in 2029 is predicted to reach $1,350, supported by bullish market trends and increased adoption.
How do Bollinger Bands reflect Aave’s volatility?
Bollinger Bands expand during high volatility, suggesting larger price swings, while shrinking bands indicate reduced market activity.
Also Read: Official MELANIA (MELANIA) Price Prediction 2025-2029: Will MELANIA Hit $35 Soon?

