- Cardano consolidates above $0.80 as volatility compresses.
- Hydra Node 1.0 launch sparks renewed investor optimism.
- Symmetrical triangle pattern suggests a breakout is imminent.
Cardano (ADA) is trading near $0.815, holding just above its ascending trendline support around $0.80 after a volatile week. Sellers tested the lower boundary of the current triangle pattern several times, but buyers have managed to defend this key level. With market sentiment stabilizing after the Hydra upgrade, ADA appears poised for a decisive move as it continues to consolidate.
Also Read: Litecoin (LTC) Price Prediction 2025–2030: Will LTC Hit $140 Soon?
Cardano Price Action and Technical Indicators
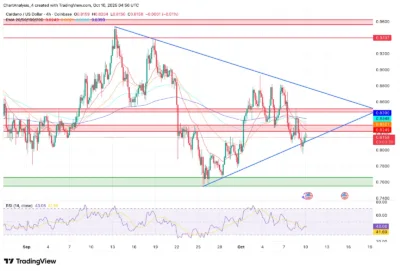
The 4-hour chart shows ADA moving within a symmetrical triangle, with support near $0.80 and resistance forming around $0.839. The 20-EMA and 50-EMA are tightly clustered at $0.824 and $0.832, respectively, marking a short-term pivot zone that could dictate near-term direction.
If ADA closes above $0.839, traders expect a bullish breakout targeting $0.86 and $0.88. However, failure to hold the $0.80 level may expose the $0.78–$0.76 demand zone — areas that triggered strong rebounds in late September.

Source: Tradingview
The RSI currently hovers around 43, reflecting mild bearish bias but suggesting oversold proximity. Overall, Cardano’s price structure indicates a period of volatility compression, often preceding a sharp breakout in either direction.
Hydra Node 1.0 Launch Sparks Fresh Optimism
The official release of Hydra Node 1.0 has reignited investor interest in Cardano. This long-awaited scaling solution is designed to enable lightning-fast, low-cost transactions, achieving speeds exceeding 1,000,000 TPS during testing. Such performance positions Cardano among the most efficient blockchain infrastructures in the market.
The community’s response has been overwhelmingly positive, with over 22,000 engagements recorded on the official announcement post. Analysts note that if developer adoption continues to rise, Hydra could revitalize network activity and offset recent price stagnation.
This technological milestone provides a strong fundamental backdrop for ADA’s price action, particularly as the token approaches a technical inflection zone around $0.84. Sustained adoption and transaction growth could serve as the key catalyst for a breakout.
On-Chain Flows Show Mild Outflows Amid Market Hesitation
Exchange data from Coinglass reveals a $1.41 million net outflow on October 10, signaling light accumulation but not yet a confirmed trend reversal. Over the past month, ADA’s flow data has alternated between inflows and outflows — a sign of cautious trader sentiment.
While outflows generally indicate accumulation, the modest scale suggests limited institutional participation for now. Open interest has remained flat, meaning speculative leverage is still subdued.
For ADA to sustain upward momentum, analysts estimate that stronger inflows exceeding $20 million would be necessary to confirm renewed conviction from larger investors.

Source: Coinglass
Technical Setup Points to a Critical Confluence Zone
Cardano’s symmetrical triangle continues to narrow between $0.80 support and $0.84 resistance. The 100-EMA is currently aligned near $0.834, reinforcing this area as a crucial breakout zone.
A close above $0.84 could trigger momentum toward $0.88 and $0.90, where prior supply pressures emerged. Conversely, a breakdown below $0.80 would undermine the ascending trendline and potentially drag ADA toward $0.76–$0.75, the July consolidation base.
With the RSI neutral near 43, the market remains in a wait-and-see phase, awaiting confirmation from either buyers or sellers.
Technical Outlook for Cardano Price
Cardano’s technical outlook remains balanced but slightly tilted toward the bullish side. The upside targets are clearly defined at $0.839, $0.86, and $0.88, where the 50- and 100-day EMAs converge, forming a crucial resistance band. A breakout above this range would signal renewed momentum and could lead to a sustained bullish run.
On the downside, support levels at $0.80, $0.78, and $0.76 remain pivotal. These correspond to the ascending trendline base that has underpinned ADA’s recent structure. A decisive close below $0.80 would weaken the technical setup and risk a deeper retracement.
Overall, the trend bias is neutral to mildly bullish, with the RSI at 43 indicating that the market is in a compression phase rather than a clear trend. This suggests that volatility is building and a breakout may be imminent.
The key catalysts to watch include the pace of Hydra adoption and on-chain inflows, both of which will determine whether Cardano can confirm a breakout and sustain higher prices in the weeks ahead.
Price Prediction for 2025–2030
| Year | Minimum ($) | Average ($) | Maximum ($) |
| 2025 | 0.76 | 0.82 | 0.90 |
| 2026 | 0.80 | 0.88 | 1.00 |
| 2027 | 0.90 | 1.05 | 1.20 |
| 2028 | 1.00 | 1.15 | 1.35 |
| 2029 | 1.10 | 1.25 | 1.50 |
| 2030 | 1.20 | 1.40 | 1.70 |
Year-by-Year Outlook
2025:
ADA could maintain its range between $0.76–$0.90, with potential for breakout as Hydra adoption gains traction and the triangle pattern resolves upward.
2026:
If developer participation and transaction volume continue to rise, Cardano could challenge the $1.00 psychological mark.
2027:
Stronger on-chain growth and ecosystem maturity may lift ADA toward $1.20, signaling renewed investor confidence.
2028:
As scalability solutions like Hydra stabilize, ADA could advance into the $1.15–$1.35 range.
2029:
Sustained network expansion and adoption may push ADA toward $1.50.
2030:
By 2030, Cardano could trade between $1.40–$1.70, reflecting cumulative network effects and strong developer engagement.
Conclusion
Cardano (ADA) stands at a critical juncture, consolidating tightly above $0.80 with a potential breakout on the horizon. The Hydra Node 1.0 launch provides strong fundamental support, while technical compression signals that a major move is imminent.
If ADA breaks above $0.84, the path toward $0.88–$0.90 becomes clear. However, failure to hold the $0.80 line could extend the consolidation toward $0.76.
Overall, Cardano remains technically constructive, with its next move likely dictated by network adoption and on-chain participation trends.
FAQs
1. What is driving Cardano’s growth?
The launch of Hydra Node 1.0, which enables high-speed, low-cost transactions, has renewed investor optimism and strengthened Cardano’s technical outlook.
2. What are the key support and resistance levels?
Key supports are at $0.80, $0.78, and $0.76, while resistances lie near $0.839, $0.86, and $0.88.
3. Is Cardano preparing for a breakout?
Yes, ADA is consolidating within a symmetrical triangle, a pattern that typically precedes significant volatility and directional movement.
4. What could trigger ADA’s next rally?
A close above $0.84 accompanied by stronger on-chain inflows could spark a sustained bullish move toward $0.90.
5. What are the risks for Cardano’s price?
Failure to maintain the $0.80 trendline or continued low inflows could delay recovery, pushing ADA toward the $0.76–$0.75 range.
Also Read: Ethereum Price Prediction for September 5: Navigating Key Resistance and Support Zones
