- ETC breaks out as bulls push past key resistance levels
- Rising volume and capital inflows signal strong investor confidence today
- Cup and handle breakout puts thirty dollar target in play
Ethereum Classic (ETC) has emerged from months of consolidation with a powerful surge, posting its most substantial daily gain since late 2023. With a 32% weekly rally, ETC has catapulted to $24.34, reclaiming a bullish structure and breaking out from a long-forming cup and handle pattern.
This rally, complemented by widening volume and good capital inflows, has offered former crucial resistances such as the levels of 27.90/30.82 to play as support-turned-to, making them the following upside objectives.
The impetus has gained new interest in the market, and the technical indicators and on-chain data tend to coincide and promote long-term bullish performance until the end of 2025.
Also Read: Tezos (XTZ) Price Prediction 2025–2030: Will XTZ Hit $1 Soon?
Technical Breakout Confirms Long-Term Pattern
After trading in a tight range below $20 for months, Ethereum Classic broke decisively above the neckline of a cup and handle formation near $18. This trend, which has been developing since March, can be regarded as one of the most powerful bullish constructions in technical analysis.
The newfound desire to move higher started with a quick up move of the $16 to $25 level in less than five sessions, with ETC breaking the horizontal resistance at the $22.94 level and retesting the $17.37 support zone.
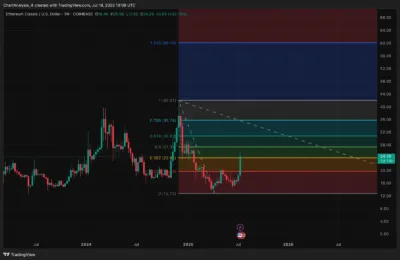
Now that price has encountered resistance at the $25.50 level, the next major phase in terms of targets is at the following levels: $27.31, which reflects 0.5 Fibonacci retracement, and $30.82, which reflects 0.618 retracement. Such levels also serve as magnets to trending markets and coincide with past supply areas, which limit upward moves.
Supposing that ETC breaks downwards to above the price level of $25.50, that would confirm a larger trend continuation figure, which can push the price up even in the Q3 and Q4 2025.
Momentum and Market Structure Support Upside
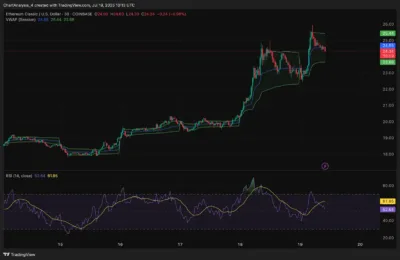
A set of bullish indicators corroborates the surge in Ethereum Classic. Although the Relative Strength Index (RSI) on the 30-minute timeframe is cooling off at an overbought area, its value stays high, leaving the $61.95, meaning that upside fun is still at it. The price action has remained above the Volume-Weighted Average Price (VWAP), which indicates strong intraday demand.

Source: Tradingview
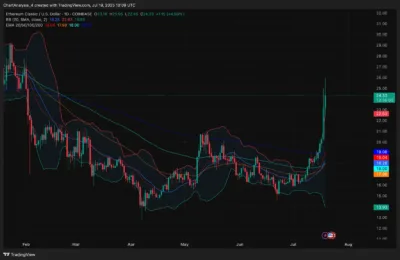
To the bullishness, the Bollinger Bands on the daily timeframe are expanded, ETC is soaring above the upper band, above the 20-day simple moving average. This implies that there is a volatility breakout that is still in progress, and this is usually linked to long-term trends.
The volume profile indicates an open space between the prices of $25 and $28, which means that the resistance may be too small. The road to recovery can be less bumpy than before, with the next volume label trading close to $27.94.
EMA Cluster Confirms Trend Reversal
ETCs’ exponential moving averages (EMAs) turned bullish all the way up. The 20, 50, 100, and 200 EMAs are piled upon each other in descending order above the current price on both daily and weekly time scales, and this is a perfect set-up to continue the bulls’ move.
The EMA20 ($19.04) and EMA50 ($17.98) are now moving sharply up with the anticipation that they will have dynamic support in the event of any dip in prices. This formation is preceding longer rallies in trending markets, and it is an indication that Ethereum Classic is no longer in a consolidation process but that it is in a confirmed uptrend.

Source: Tradingview
On-Chain Capital Inflows Reinforce Bullish Breakout
The second factor supporting this breakout is the significant change in on-chain investor action. Coinglass stated that Ethereum Classic had clocked the largest single-day positive flow since March 19, with about $1.69 million net spot inflows on July 19. This implies that the breakout has renewed investors’ interest after a long period of stagnation.
These flows reflect not only the new money entering the market but also the buyers’ great confidence. It is a big influx in the context of a technical breakout and trend reversal, so this is typically seen as an anticipation of additional upside momentum.

Source: Coinglass
ETC Price Forecast 2025–2030
Depending on the technical information and the on-chain data that we have at this moment, we can make the following projection of the potential of Ethereum Classic in the next six years:
Year low ($) mean ($) high ($)
2025 20.50 27.00 30.82
2026 25.00 32.50 40.00
2027 30.00 38.00 48.00
35.00 44.00 55.00 2028
2029 38.00 50.00 63.00
2030 40.00 58.00 72.00
Year-by-Year Outlook
2025
Ethereum Classic is surmounting long-term resistance with targets of $27.90 and $30.82. To sustain this momentum, the price should not fall below $23.00 and preferably $21.80. Failure to keep the price above $20.50 would diminish the bullish formation.
2026
If crypto market conditions improve, ETC might reach a value of around $32.50, with the resistance level at $40.00 over the long term. Further network and capital inflow will also be imperative to maintaining this shift.
2027–2028
Assuming that Ethereum Classic will remain relevant in the use of smart contracts and decentralized applications, the price of $48 to $55 per coin can become a reality. This trajectory will be immensely affected by market cycles, competition, and adoption cycles.
2029–2030
At scale, with blockchain and ETC adoption into enterprise-level or financial services, the price may rise to reach up to $70$+. This prospect, however, will rely on the growth of the ecosystems and the changing utility of the token throughout time.
Conclusion
Ethereum Classic’s recent breakout is more than a short-term spike—it’s a structural shift backed by solid technicals and renewed investor interest. The confirmation of the cup and handle pattern, bullish EMA alignment, substantial volume, and capital inflows point toward a potential rally toward $30 and beyond.
The next critical resistance lies at $25.50, and a successful breakout could see ETC test $27.90, followed by $30.82. However, bulls must defend key support levels, especially $23.00 and $21.80, to preserve the current trend structure. For now, Ethereum Classic is showing clear signs of a renewed bullish phase.
FAQs
1. Is Ethereum Classic currently bullish?
ETC has broken out of a multi-month pattern, with supporting signals from volume, EMAs, and on-chain flows.
2. What is the next central resistance zone?
$25.50 is the immediate resistance breaking above could lead to $27.90 and $30.82.
3. Where is the strongest support?
$23.00 is the first line of support, followed by $21.80 and $20.50.
4. Can ETC reach $30 this year?
If current momentum continues, ETC could test $30.00 by late 2025.
5. What’s driving ETC’s rally?
A confirmed technical breakout, bullish momentum indicators, and over $1.6M in spot inflows are fueling the move.
Also Read: Schwab Set to Launch Spot Bitcoin and Ether Trading to Rival Coinbase

