Ethereum is again defending its ground above the $2,500 level following a rejection from the $2,700 resistance zone. The digital asset is showing signs of consolidation after recent volatility. This phase has opened the door for long-term analysis as investors assess Ethereum’s price outlook over the next five years. Current market conditions offer a mix of caution and underlying optimism as ETH holds key structural levels.
Short-term movements aside, Ethereum remains one of the most active and foundational assets in the digital space. As its ecosystem evolves and demand for decentralized applications grows, ETH’s utility and scarcity may contribute to price growth. With this backdrop, price predictions through 2029 consider technical signals, macro trends, and on-chain metrics.
Also Read: XRP Ledger Just Got a Major Upgrade With Batch Transactions Feature
Technical Analysis Overview
Ethereum’s price structure reflects indecision on shorter timeframes, but technical indicators offer insights into potential future movement.
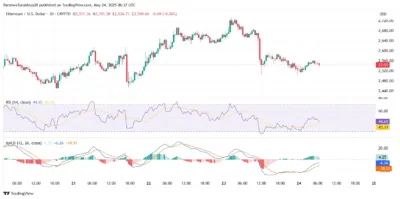
The MACD (Moving Average Convergence Divergence) on the 30-minute chart has printed a mild bullish crossover. Although the histogram momentum is still weak, the crossover suggests that downside momentum may be fading. ETH could gather strength for a short-term breakout if momentum increases and the MACD line crosses further above the signal line. However, the absence of substantial volume remains a limiting factor.
The Relative Strength Index (RSI) attempts to recover from sub-50 levels. It hovers around 44.65, which signals that Ethereum is neither oversold nor overbought territory. A sustained move above 50 would indicate a shift toward bullish sentiment, confirming the potential for upward price movement. The RSI will be critical in the coming days as it reflects market momentum and potential exhaustion levels.

Source: Tradingview
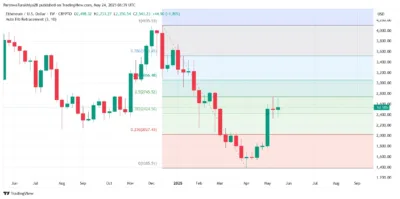
Meanwhile, the Fibonacci retracement is drawn from the local high of $2,733 to the recent low near $2,350, showing Ethereum currently holding around the 0.382 level at $2,424. If the Price manages to reclaim the 0.5 retracement zone near $2,545, this would mark a key signal of recovery. Climbing above this level could provide enough bullish pressure to retest the $2,600 resistance. However, continued rejection from these zones may cause ETH to revisit the 0.382 or even the 0.236 support levels.
These three indicators combined suggest that Ethereum is in a transitional phase. The asset shows early signs of strength but has yet to break into a confirmed uptrend.
Ethereum Price Prediction Table (2025–2029)
| Year | Minimum Price ($) | Average Price ($) | Maximum Price ($) |
| 2025 | 2,300 | 3,100 | 4,200 |
| 2026 | 3,000 | 4,500 | 6,000 |
| 2027 | 4,200 | 6,300 | 8,000 |
| 2028 | 5,800 | 7,900 | 10,500 |
| 2029 | 7,000 | 9,800 | 12,700 |
Yearly Ethereum Price Insights
2025
Ethereum may continue consolidating early in 2025 before reclaiming higher ground. A successful flip of resistance zones into support could allow ETH to reach $4,200.
2026
Institutional adoption and improved scalability may lift Ethereum’s average Price to $4,500. Breaking past $6,000 would require broader market participation and network utility growth.
2027
ETH could gain more momentum with further developments in decentralized finance and Ethereum-based applications. Price may push toward the $8,000 range if bullish sentiment holds.
2028
A tightening supply model and expanded real-world adoption could drive prices toward the $10,500 mark. Still, volatility is likely to cause periodic corrections.
2029
Ethereum could approach $13,000 as global usage and developer activity grow. If the macro environment remains favorable, ETH may stabilize at around $10,000 on average.
Conclusion
Even though markets are uncertain, Ethereum has held its support, and with the help of MACD, RSI, and Fibonacci retracement zones, it is clear that the asset is currently facing a significant choice. Technology and rising usefulness still uphold its long-term prospects. Should Ethereum’s trend continue, substantial progress is expected to be recorded by 2029, driven by increased institutional activity and more Ethereum applications.
FAQs
1. What is the role of RSI in Ethereum’s price prediction?
RSI helps identify momentum and can signal potential bullish or bearish shifts.
2. How does the MACD affect the Ethereum price outlook?
MACD indicates trend strength and direction changes, which is crucial for tracking momentum.
3. Why is Fibonacci retracement significant for ETH forecasts?
Fibonacci levels highlight likely support and resistance zones during retracement or recovery phases.
4. Could Ethereum reach $10,000 by 2028?
Based on projections and adoption trends, ETH could reach or exceed $10,000 by 2028.
5. What Price could Ethereum fall to if it fails to hold support?
If ETH loses the $2,500 support, it may revisit levels near $2,426 or even $2,350.
Also Read: Wall Street Titan Scaramucci Backs Solana to Disrupt $7T Finance Market

