Ethereum traded around $2,448 on Tuesday after failing to hold above the $2,470 resistance level. The asset had rebounded from June’s lows of $2,100 but now moves within a tight range, reflecting market indecision.
Ethereum was stuck under key resistance areas last week of trading, with overbought momentum oscillators indicating an accumulation of power that could send Ethereum through the roof.
Price action is confined to a multi-month symmetrical triangle, so a breakout or breakdown will soon occur.
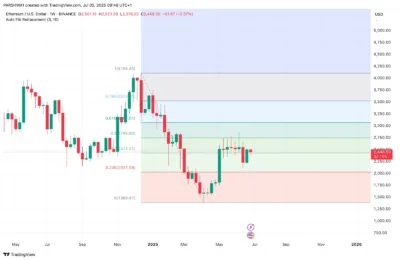
The monthly chart shows that the price of Ethereum is still consolidating between the long-term uptrend support registered in March 2020 and the resistance line that moves to the downside because of the all-time high of $4,900.
Several attempts below $4,100 indicate that sell pressure remains in play, and support at 2,130 has held on three occasions since the middle of 2023.
Currently, Ethereum is trading between $2,424 and $2,745 on the weekly chart, a range identified as a Fib retracement zone. The price of $2,424 has become one of the central turning points.
Although it has tried to rebound a few times, ETH is kept down by weakening momentum and decreasing chart highs.

Source: Tradingview
Also Read: Ripple Officially Joins Global Neo-Bank List, Shaking Up Finance Industry
Momentum Indicators Suggest Limited Upside Without Strong Volume
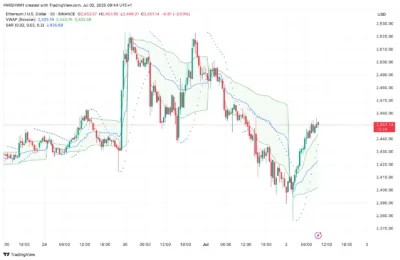
Ethereum’s 4-hour chart shows multiple rejections at the mid-Bollinger Band, with the 20, 50, 100, and 200 EMAs clustering between $2,444 and $2,463. This resistance zone has capped recent bullish attempts. Moreover, a lack of sustained buying volume has made it difficult for bulls to establish control.
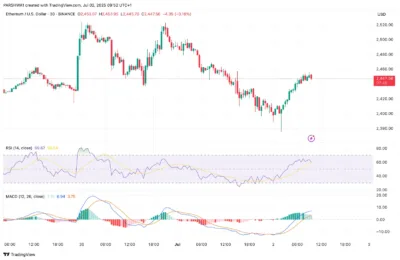
The MACD indicator in the 30-minute chart indicates that the bullish movement is declining and the RSI is cooling, a bit under the overbought level at 59.04. Whereas the Parabolic SAR is in line with the current bounce, On-Balance Volume is flat and shows minimal accumulation.
The price movement lies within a limited pitchfork channel that has been modified after an upward trend, and support is provided a little above 2406. ETH is now trying to regain the zone of $2,475. But the inability to penetrate may open it to a new downside.
When looking at Ichimoku Cloud and VWAP on shorter time frames, the picture is becoming less optimistic, as Ethereum is trading below the daily VWAP of $2,443, further reinforcing consolidation.

Source: Tradingview
A break above $2,470 on sustained volume would open an entry route to a potential target of $2,520 and an eventual $2,594 given improvement in volume.
Provided ETH loses momentum and falls to below $2,424, the downside options depend on two targets: $2,312 and $2,211. The macro’s long-term stability is still at $2,131.
Ethereum remains caught between a firm support base and multiple resistance zones. While the technical setup suggests a breakout could follow, weak momentum and low volume continue to suppress immediate upside potential. Bulls must defend $2,424 to avoid deeper retracement.
Also Read: XRP Dominates Upbit Trading, Leaves Bitcoin and Ethereum Behind

