- Hyperliquid stumbles after a steady run, but eyes recovery with firm support at key moving averages.
- HYPER struggles to reclaim bullish momentum amid consolidation under pressure.
- RSI nearing oversold zone hints at potential reversal as investors watch for breakout cues.
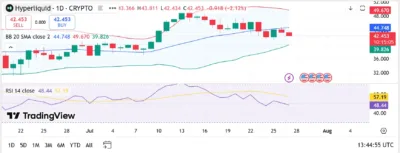
Hyperliquid (HYPER) is an emerging name in decentralized derivatives, and the coin is at the price of 42.453 at the time of writing, which is 2.12 percent on the day. Following a sharp momentum in early July, the token is currently in a cooling-down period, as the bears and bulls engage in an intense struggle to pull the token up or down. Most traders are now keenly observing the technical indicators to determine whether there will be another breakout or not.
Nevertheless, the overall trend stays bullish over the longer term. The current price is close to the key support zones, and thus, it may wish to make an upswing further in a few months.
Also Read: Hedera (HBAR) Price Prediction 2025–2030: Will HBAR Break $0.34 Soon?
Technical Analysis
Bollinger Bands
At the moment, HYPER is priced right below the Bollinger band (20-day SMA) at 44.748, which indicates a neutral or slightly bullish trend. The bands at the upper and lower positions are 49.670 and 39.826, respectively, creating a tightening squeeze, which, in most cases, is the precursor of a major price swing.
The existing configuration indicates that HYPER is accumulating at Bollinger Bands following a short-lived rise in mid-July. The lack of movement of price near the middle of the band indicates indecisiveness, but it can also mean that when volume is received, there will be a volatility breakout.
RSI Behavior
This Relative Strength Index (RSI) currently stands at 48.44, which is comfortably located below the neutral line of 50. This is an essential note of lost bullish momentum, but it also conveys that HYPER has not yet reached the oversold position.
The RSI has been moving lower ever since it peaked at 57.19, indicating further consolidation or slight weakness till a reversal is witnessed.
A bounce off the 40–45 RSI range could spark renewed interest and signal an incoming move higher, especially if it coincides with a breakout above the Bollinger mid-line.
Support and resistance zones
The closer and more immediate support is at 39.826, the lower Bollinger band. Any powerful rebound off this axis floor would confirm its status as a floor and make way for another leg upwards. Beneath that, there is psychological support of $36.00 and $32.00.
The first level of resistance lies on the 20 days SMA at $44.748. A break above this would indicate a test of the upper band of 49.670 and then higher at 52.00 and 60.00 should the momentum precede.

Source: Tradingview
Hyperliquid (HYPER) Price Prediction Table (2025–2029)
| Year | Minimum Price | Average Price | Maximum Price |
| 2025 | $35.00 | $45.00 | $60.00 |
| 2026 | $42.00 | $58.00 | $78.00 |
| 2027 | $55.00 | $70.00 | $90.00 |
| 2028 | $65.00 | $82.00 | $1.00 |
| 2029 | $72.00 | $88.00 | $1.15 |
Year-by-Year Price Breakdown
2025
If HYPER holds support above $39.00 and breaks above $45.00, it could revisit the $60.00 mark before year-end. However, if sellers dominate, it may retest $35.00.
2026
Institutional interest and market expansion in on-chain derivatives could push average prices toward $58.00, with possible peaks at $78.00 as adoption grows.
2027
With broader crypto market maturity and regulatory clarity, HYPER could establish itself as a leading derivatives platform, pushing prices to $90.00.
2028
Assuming continued ecosystem growth, HYPER could test the $1.00 milestone, supported by platform upgrades and strategic partnerships.
2029
A well-established Hyperliquid network may push the token beyond $1.00, reaching up to $1.15 in a bullish macro environment.
Conclusion
Hyperliquid is currently in a technical cooling phase, but the long-term outlook remains optimistic. RSI levels suggest it’s not yet oversold, and Bollinger Band compression hints at upcoming volatility. If support holds and buying pressure increases, HYPER could soon resume its upward trajectory.
As decentralized derivatives continue to grow, Hyperliquid stands out with a robust infrastructure and scalable architecture. Its mid-to-long-term growth potential remains promising, especially as institutional adoption deepens.
FAQs
1. Is HYPER currently oversold?
No, with an RSI of 48.44, HYPER is in neutral territory — neither oversold nor overbought.
2. What is the strongest support level now?
The lower Bollinger Band at $39.826 serves as key support, followed by $36.00.
3. What resistance must be broken to confirm bullish momentum?
A break and close above $44.748 (20-day SMA) would signal a return to bullish conditions.
4. Is $1.00 a realistic target in the near future?
Yes, $1.00 is achievable by 2028 if market conditions remain bullish and adoption continues.
5. What are Hyperliquid’s main growth drivers?
Key drivers include demand for decentralized derivatives, platform scalability, and integration with institutional trading infrastructure.
Also Read: Stellar (XLM) Set to Explode? Peter Brandt Predicts Massive Breakout
