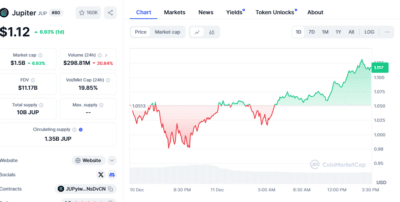
Jupiter (JUP) has shown promising signs of recovery, with market analysts forecasting a potential price rally of up to 44.75%. The token’s price recently climbed by 6.93%, rising from approximately $1.053 to $1.117 in the last 24 hours. This gain comes despite a 30.84% drop in trading volume, now at $298.81 million.

Source: CoinMarketCap
JUP’s recent movement has been guided by an ascending channel, a technical pattern characterized by upward price momentum between support and resistance levels. The token has shown a positive response after briefly declining to $1.0118, a critical support zone coinciding with the channel’s lower boundary. If the current trend holds, JUP could reach $1.46, representing a substantial gain for investors.
Also Read: Toncoin Faces Crucial Test as Market Consolidates and 2025 Approaches
Technical Indicators Signal a Bullish Outlook
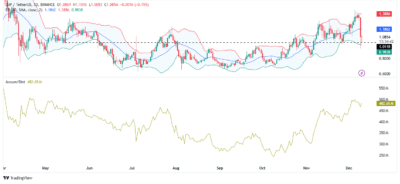
Jupiter’s price action has aligned with key technical indicators, hinting at a potential turning point for the asset. The token’s decline to the lower bound of the Bollinger Bands, a widely used volatility indicator, signals oversold conditions. Such conditions often precede a reversal, reducing selling pressure and creating opportunities for recovery.

Source: Trading View
The Accumulation/Distribution indicator further reinforces this optimistic outlook. Rising accumulation trends suggest investors actively buy the token, indicating growing market confidence. This shift in sentiment is reflected in negative four-hour Exchange Netflows, highlighting that more JUP tokens are withdrawn from exchanges than deposited, reducing the available supply and signaling decreased selling pressure.
Market Sentiment and Supply Dynamics Drive Optimism
The recent uptick in accumulation suggests market participants are positioning themselves for potential gains. A reduced supply of JUP on exchanges and increased demand could drive a further price surge. This scarcity effect is expected to support upward momentum, aligning with predictions of a rally toward $1.46.
Conclusion
Jupiter appears poised for further gains with strong support levels, favorable technical indicators, and growing investor confidence. If current trends persist, the token could capitalize on its momentum, offering significant upside potential for traders and investors.
FAQs:
What is the current price prediction for JUP?
Analysts predict JUP could rise to $1.46, representing a potential 44.75% gain if current trends persist2
What technical indicators suggest a potential JUP rally?
Indicators like the Bollinger Bands and Accumulation/Distribution trends highlight oversold conditions and rising accumulation, signaling potential bullish momentum.
What does the Exchange Netflow data reveal about JUP?
Negative Exchange Netflows indicate more JUP is being withdrawn from exchanges than deposited, reflecting reduced selling pressure and growing market confidence
Also Read: Why Memecoins Are Surging Up Today? Top Memecoins to Watch
