Moving against the market sentiment, Brett (BRETT) and GameStop (GME) marked record performance amidst top memes’ stagnation. But are we seeing a positive retest?
As the market has been sluggish in anticipation of FOMC updates, memecoins caught up with the tendency and have been showing sharp downticks. However, not all ‘memes’ followed the tough tendency. Can Brett’s and GameStop’s upturns serve as a silver lining for the meme-inspired assets? Figuring out below.
PEPE, DOGE, and SHIB Going South
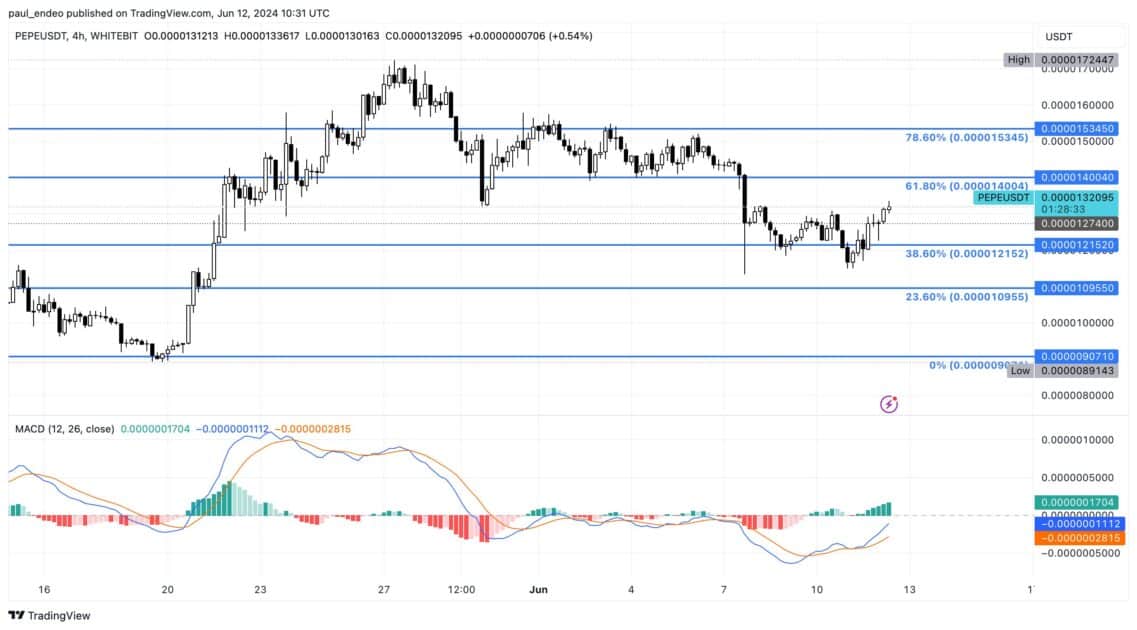
Pepe (PEPE) – one of the leading ‘memes’ in the crypto market – switched the trend since updating its all-time high of $0.000017. For over two weeks, the coin had been trapped in a falling wedge between 0.618 and 0.386 Fibonacci levels, recorded at the prices of $0.000014 and $0.0001215 respectively.
PEPE/USDT 4h chart. Source: WhiteBIT TradingView
Read Also: Shiba Inu Investors Warned About Fake TREAT Token Releases
This dynamic marked a 16% weekly regression, with moving average convergence divergence (MACD) indicating a downturn at most, and moving averages staying below 0. Following the 0.386 Fib breakout, Pepe eventually pinned $0.000011 resistance and bounced back, paving its way to $0.000014. The recovery spurs optimism in the asset, yet not all memes managed to break out of the bearish sentiment.
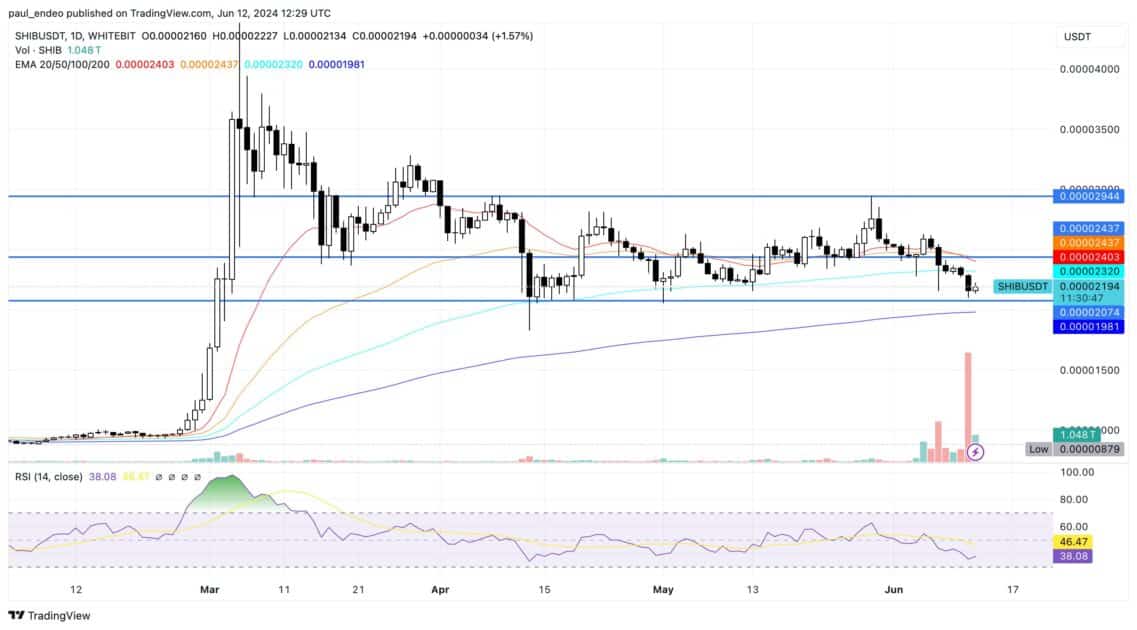
Shiba Inu (SHIB) has been keeping up its sideways outlook, registering a prevailing selling activity. Trading between $0.000020 and $0.000029 marks, the coin’s relative strength index (RSI) reveals the ongoing downward sentiment for the asset.
SHIB/USDT 1D chart. Source: WhiteBIT TradingView
The same outlook is pictured by the exponential moving averages, with a 20-day EMA hinting at the continuation of a local correction. Dogecoin (DOGE), the largest memecoin in the market, was not spared from the recent decline as well. While DOGE’s volume slightly increased, analysis indicates that sellers dominated it.
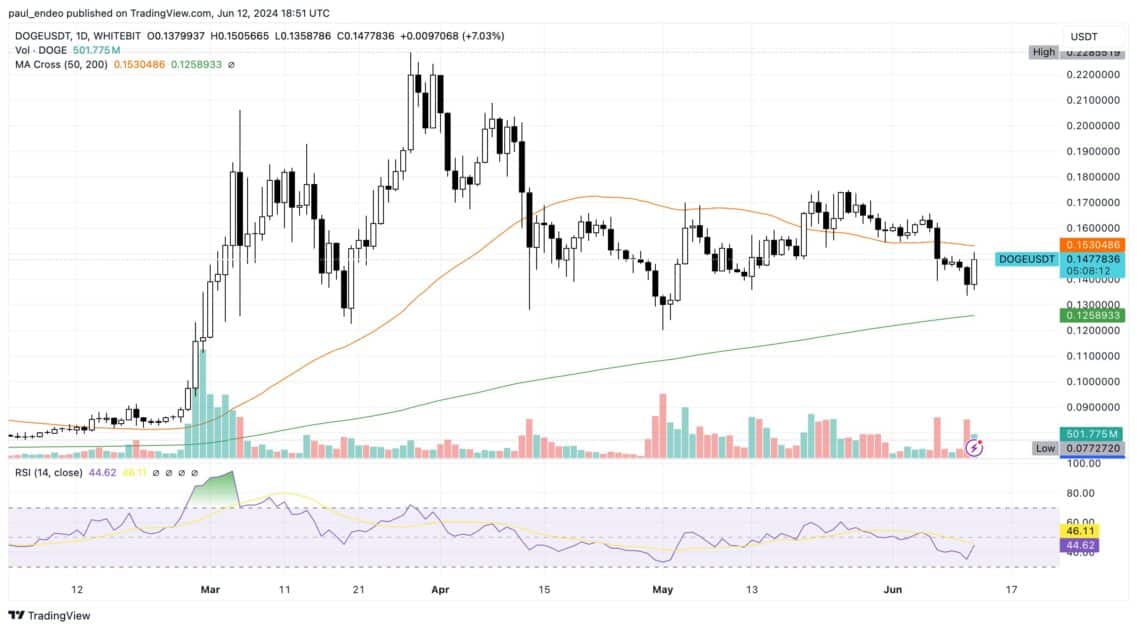
According to the daily chart, Dogecoin’s decline kicked in around June 7, dropping over 7% from $0.16 to $0.148. Within the downturn, the price fell below its 50-day moving average (orange line) and took it below the neutral line on its RSI, indicating a bear trend.
DOGE/USDT 1D chart. Source: WhiteBIT TradingView
The regressive trend is going on, as DOGE remains stuck at the $0.1477 range at the writing time. Dogecoin’s market capitalization also showed a significant decline. Data from Coinglass indicated that after the coin’s 7% downturn, its market cap fell below $21 billion.
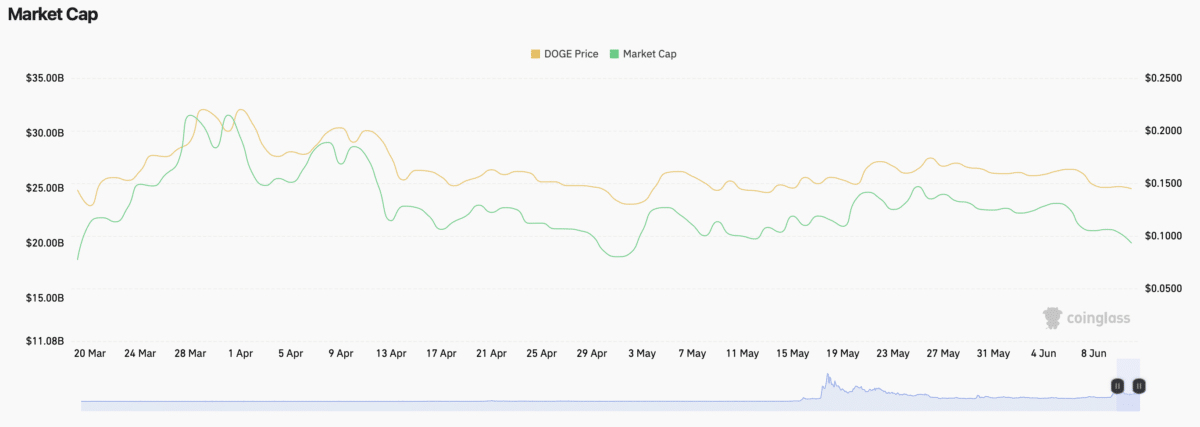
Dogecoin (DOGE) market capitalization. Source: Coinglass
Seeing that DOGE’s volume has significantly increased in the last 24 hours, it remains the largest memecoins in the market. Meanwhile, it turned out to be outperformed by newly popular assets – just like the other leading memecoins.
BRETT and GME Stealing the Show
On June 9, Brett (BRETT), a Base-developed memecoin, managed to achieve its all-time high of $0.1955. A week before reaching the milestone, Brett secured a $1 billion market capitalization, which elevated it to over $2 billion with ATH.
Being a response to the dominating Solana-based memecoins, Brett remains the most valuable cryptocurrency on Base, while its market cap slightly diminished to $1.61 billion at the writing time. Despite a slight correction, Brett managed to produce a dramatic 375% upswing in the last 30 days. What is more, the coin’s social dominance keeps spiking, despite a slightly bullish indication in recent days. Weighted Sentiment also reveals a broader bullish perspective on the asset.
Read Also: The Future of Dogecoin: How High Can This Cryptocurrency Reach?
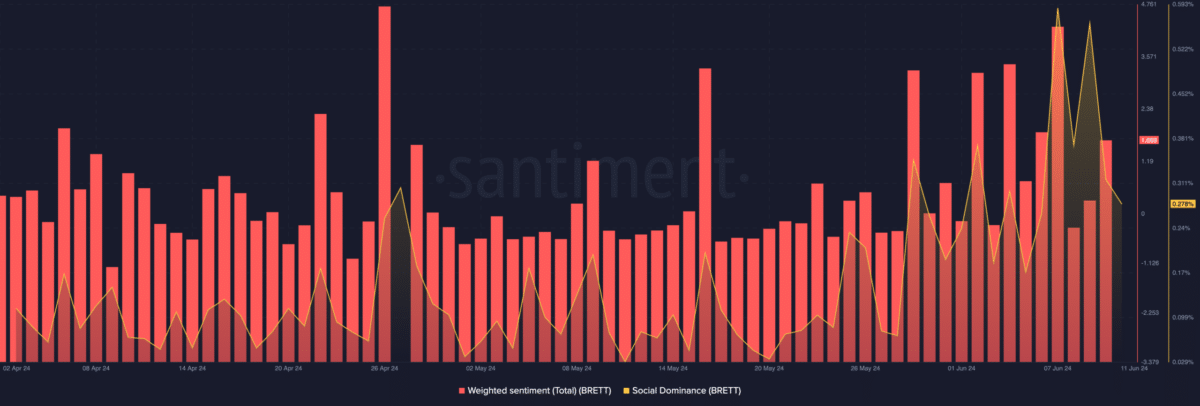
Brett (BRETT): Weighted Sentiment and Social Dominance. Source: Santiment
The correction seems to be perceived as a buying opportunity, seeing strong buzz around Brett. This is also proved by the 4-hour chart. According to it, the 0.382 Fibonacci level recorded the $0.12 price, indicating that the one was a nominal pullback. If selling pressure increases, Brett could find support at this specific point.
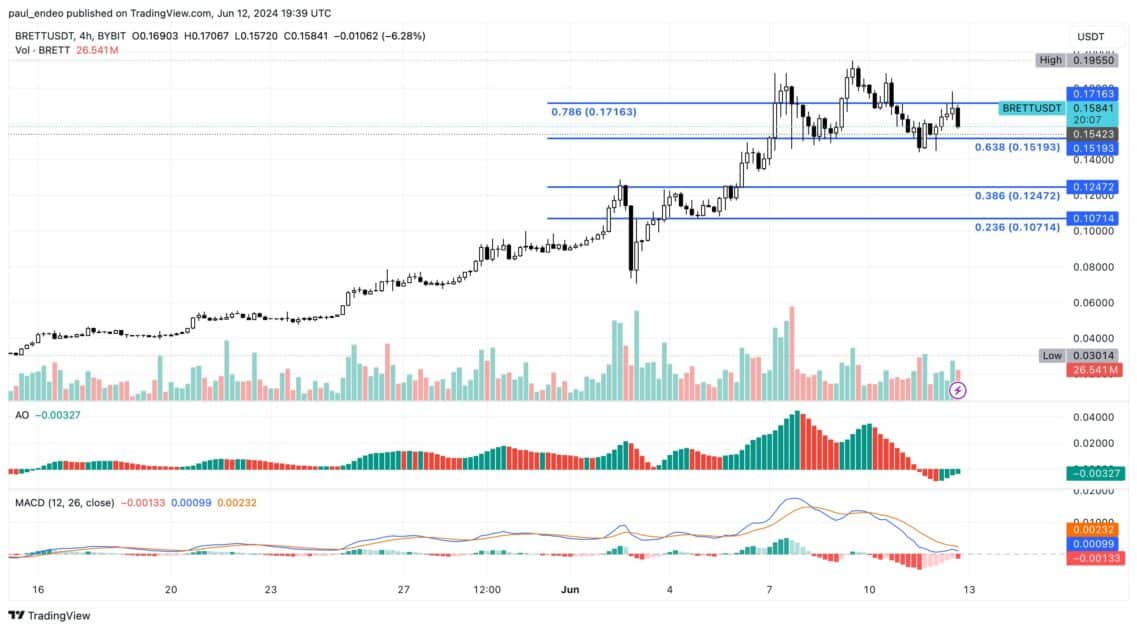
BRETT/USDT 4h chart. Source: TradingView
The Awesome Oscillator (AO) demonstrates a bearish reading. The red histogram bars indicated that the momentum was heading downwards. AO’s reading correlated with moving average convergence divergence (MACD), which stood below zero at the writing time. What is more, the 12 EMA had crossed below the 26 EMA, supporting a decline. Ultimately, BRETT’s price might drop to $0.14 or $0.12, given the Fib levels.
As BRETT’s sellers outpaced its buyers, the identical dynamics are demonstrated by GameStop (GME). The memecoin has increased by over 50% in the last 7 days and noted a staggering 7,962.12% pump in the recent month. What is more, the Santiment data reveals that Social Dominance is still at a high level, significantly overtaking top memecoin Doge’s Weighted Sentiment.
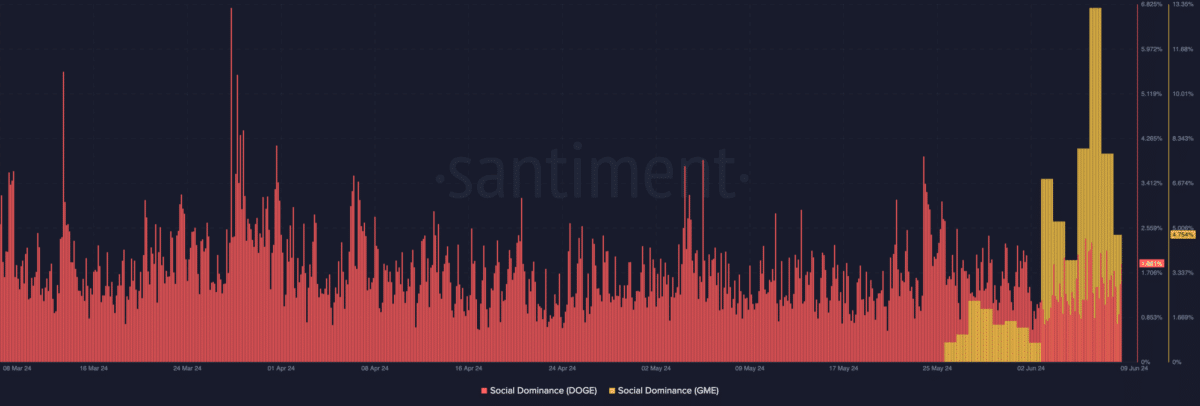
Source: Santiment
As per the 4-hour chart, RSI proves that GME is experiencing sellers’ domination. While it hit a local top, the decline could be a sign that, despite the memecoin dominance, the token is at a discount.
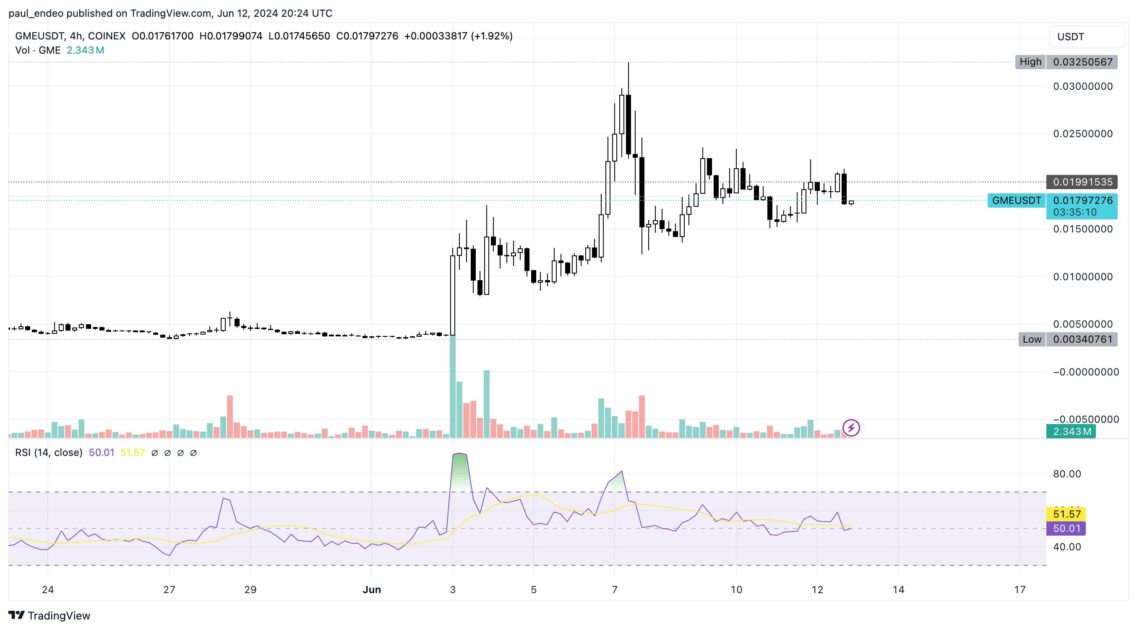
GME/USDT 4h chart. Source: TradingView
The leading memecoins price dips are nothing else than an indicator of the selling dominance, which is a logical outcome for the assets that reached their local highs in momentum.
Read Also: Smart Whale Profits $3.49 Million From PEPE, Spreads Gain to SHIB and SAND
