- MEME attempts a breakout after prolonged downtrend
- Trendline break and EMA reclaim spark the first structural improvement
- Bulls eye $0.00260 if momentum builds in coming months
Mecocoin (MEME) is still in the process of breaking a multi-month downtrend line after reaching a low of about $0.00136. The price dynamics have been orienting towards the area of about $0.00187 once again, recovering major exponential moving averages (EMAs) and attacking the previous range of opposition with a sharp surge in points that briefly reached $0.00250.
On the positive side, the chart structure has turned bullish even though risks are still prevalent with lower liquidity and cooling hype. Bulls are trying to use $0.00185-$0.00205 as a good platform for the bulls to maintain continuous movement.
Also Read: Coinbase to Delist Function X (FX) Following Contract Suspension, Adds New Assets to Platform
Technical Indicators Point to Reversal Potential
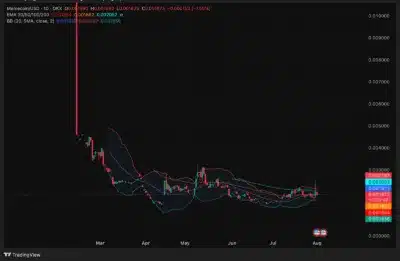
Daily indicators also refer to the slowing of the bearish momentum. Still, at the same time, the EMAs are lining up, and the Bollinger Bands are expanding, which demonstrates an approach to the volatility.
Bollinger Bands show a tendency to start separating, which is another typical indication that a volatility period has been set to begin. The current trade of EME above 20-day and 50-day EMAs (~$0.00185- $0.00186) means that the next key obstacle is the 100-day EMA at $0.00205.

Source: Tradingview
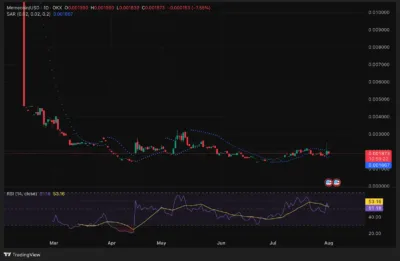
The Relative Strength Index (RSI) has also picked up and now reads 53.16 against sub-40 levels in June. The Parabolic SAR has crossed below the price, and this should be an early indication of a possible trend reversal confirmation. Such technical matchups form the basis of an argument regarding a breakout regime until at least the end of 2025.

Source: Tradingview
Short-Term Trendline Retest May Define 2025 Path
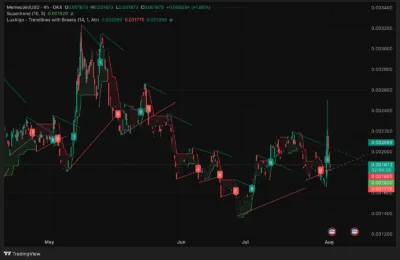
The 4-hour Supertrend turns bullish when it increases above the price of about $0.00182. Although the breakout failed to go above $0.00250, the structure still remains above the pivot.
On the 4-hour chart, a recent breakout from a consolidation wedge triggered a Supertrend buy signal near $0.00182. Price staged a rally to hit as high as the $0.00250 region but was repelled at that point and returned to test the support pivot of at least the $0.00177 or the lower end of the $0.00177 to $0.00185 support range.

Source: Tradingview
The present zone could be critical to propelling MEME to its April peak of $0.00260. If the price continues trading above the 100-day EMA and selling pressure starts reappearing, buyers can take the lead in the future in the year.
MEME Price Forecast 2025–2030
| Year | Minimum ($) | Average ($) | Maximum ($) |
| 2025 | 0.00136 | 0.00192 | 0.00260 |
| 2026 | 0.00130 | 0.00215 | 0.00310 |
| 2027 | 0.00165 | 0.00240 | 0.00385 |
| 2028 | 0.00200 | 0.00285 | 0.00450 |
| 2029 | 0.00240 | 0.00340 | 0.00520 |
| 2030 | 0.00290 | 0.00395 | 0.00600 |
Year-by-Year Outlook
2025
MEME is in the early stages of a breakout attempt, and if the $0.00185–$0.00205 range flips to support, a move toward the $0.00260 zone is possible. The most important thing is to maintain above 0.00136 to extend the bullish formation.
2026
With a base-building process in progress, MEME may end up averaging $0.00215. If $0.0020 -$0.0022 becomes supportive, the price can extend to $0.00310.
2027–2028
Its trend growth and possible memecoin revival may boost MEME to the levels of $0.00385 and even $0.00450. Further interest and high bottoms beyond $0.00165 will be needed to turn it into confirmation.
2029–2030
That being the case, price may rise to $0.00520 in 2029 and could travel uphill to the 2030 milestone at $0.00600. This will be determined by the overall market cycles as well as the cultural positioning in the memecoin arena.
Conclusion
This push has come after several months of pedestrian consolidation, which EE is taking in stride. Coupled with Bullish indicators on the daily and intraday charts, there is a possibility of the price building a base at the market above the level of 0.00185.
A move above $0.00205, showcasing favorable news, would trigger a breakout above the current range and open the door to $0.00260 later this year. Nonetheless, traders should observe rejection and hedge downside threat at around $0.00136. It remains to be seen in the next few years whether MEME can be considered an ephemeral trend or a cycle-proof investment.
FAQs
1. Is Memecoin (MEME) going bullish?
Yes. The newfound uptrend has also seen it break a long-term trendline and rewind EMAs to indicate early bullishness.
2. Where is the next significant resistance?
The next resistance zone will be at $0.00205–$0.00250, with a bullish continuation confirmed by a close above $0.00260.
3. Where is the best support?
The macro support at $0.00136 remains in force, and $0.00185-$0.00205 are the levels of importance regarding trend confirmation.
4. Will MEME move to $0.00260 by the year-end?
Yes. In case of high volume and structural maintenance, MEME might hit the April high of 2025, which is equivalent to $0.00260, again.
5. What is behind the revival of MEME?
RSI rebound, breakout attempts above trend resistance, Parabolic SAR flip, and EMA alignment are also some of the influences.
