Movement Network (MOVE) has emerged as a leading blockchain ecosystem built on the Move programming language, aimed at achieving scalability, interoperability, and high performance. By bridging the gap between the Move and Ethereum Virtual Machine (EVM) ecosystems, Movement offers developers a modular, high-speed, and secure platform for building blockchain applications. With support from prominent investors and increasing adoption of the Move programming language, the MOVE token has captured attention in the decentralized finance (DeFi) space.
Also Read: SushiSwap (SUSHI) Price Prediction 2025-2029: Will SUSHI Price Hit $45 Soon?
Technical Analysis
Bollinger Bands Analysis
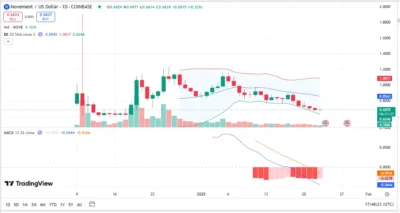
Bollinger Bands offer valuable insights into MOVE’s price volatility and potential trends. These bands consist of three components: the upper, middle band (SMA), and lower, which expand during high volatility and contract during market consolidation. The chart shows that MOVE’s Price hovers near the lower Bollinger Band, signaling bearish momentum. This positioning suggests the token might be oversold, creating the possibility of a rebound toward the middle band. Historically, similar scenarios have led to a brief upward correction. However, if selling pressure persists, MOVE could continue to test the lower band before stabilizing. The shrinking width of the bands indicates reduced volatility, potentially signaling an upcoming breakout in either direction.
MACD Analysis
The Moving Average Convergence Divergence (MACD) indicator measures market momentum and helps identify trend reversals. It is derived by subtracting the 26-day EMA from the 12-day EMA, with the resulting MACD line compared to the signal line (9-day EMA). Currently, MOVE’s MACD line is below the signal line, and the histogram displays consistent red bars, reflecting sustained selling pressure. This trend indicates bearish momentum. However, the narrowing gap between the MACD and signal lines suggests that a bullish crossover may occur soon. Such a crossover would signal a potential upward trend driven by increased buying pressure.

Source: Tradingview | Bollinger Bands | MACD
Movement (MOVE) Price Prediction Table (2025-2029)
| Year | Minimum Price ($) | Average Price ($) | Maximum Price ($) |
| 2025 | 2.50 | 5.00 | 8.00 |
| 2026 | 2.50 | 3.00 | 5.50 |
| 2027 | 3.00 | 4.50 | 7.50 |
| 2028 | 4.00 | 6.00 | 9.00 |
| 2029 | 8.00 | 12.00 | 20.00 |
Movement (MOVE) Price Prediction
2025
In 2025, MOVE is expected to recover from its current bearish momentum and experience steady growth, with the token’s minimum Price projected at $2.50 and an average trading price of $5.00. Positive developments in the Movement ecosystem and broader adoption of the Move programming language could push the maximum Price to $8.00.
2026
Following the bullish trends of 2025, the market may undergo a correction in 2026, during which MOVE’s Price is likely to stabilize, with minimum and average prices expected to be $2.50 and $3.00, respectively. The maximum Price could reach $5.50, but overall growth may slow as the market consolidates.
2027
By 2027, MOVE is anticipated to consolidate and gradually gain momentum as the market adjusts to the previous correction. The token’s minimum Price is projected at $3.00, with an average trading price of $4.50. If market conditions remain favorable, MOVE could achieve a maximum price of $7.50 by the year’s end.
2028
2028 is expected to bring significant bullish momentum, driven by the crypto community’s optimism surrounding the Bitcoin halving event. MOVE’s Price is projected to rise to a minimum of $4.00, with an average of $6.00 and a maximum of $9.00. Increased adoption of the Movement Network and improvements in its ecosystem could contribute to this growth.
2029
In 2029, MOVE is expected to reach its peak performance, with a potential maximum price of $20.00, a minimum price of $8.00, and an average price stabilizing around $12.00. This growth will likely be fueled by widespread adoption, market maturity, and Movement Network’s continued innovation in blockchain interoperability.
Conclusion
The Movement Network’s potential for growth between 2025 and 2029 reflects its strong fundamentals, innovative technology, and increasing adoption. While corrections are expected in 2026, the token’s long-term outlook remains optimistic, with significant growth anticipated in 2028 and 2029. By leveraging the Move programming language and bridging the gap between Ethereum and Move ecosystems, the Movement Network is positioned to play a crucial role in the blockchain industry. Investors and traders should monitor key technical indicators like Bollinger Bands and MACD to identify potential opportunities and trends in MOVE’s price trajectory.
FAQs
What is Movement (MOVE)?
Movement (MOVE) is a blockchain ecosystem designed using the Move programming language for high performance, interoperability, and scalability.
How do Bollinger Bands help analyze MOVE’s Price?
Bollinger Bands measures price volatility and helps identify overbought or oversold conditions for MOVE.
What does the MACD indicator suggest about MOVE’s momentum?
The MACD indicates bearish momentum for MOVE, but a potential bullish crossover could signal an upward trend.
Can MOVE reach $20 by 2029?
MOVE is projected to reach a maximum price of $20 by 2029, driven by increased adoption and ecosystem growth.
What risks should investors consider when trading MOVE?
Investors should consider market volatility, competition, and potential regulatory changes when trading MOVE.
Also Read: Raydium (RAY) Price Prediction 2025-2029: Will RAY Hit $ 10 Soon?
