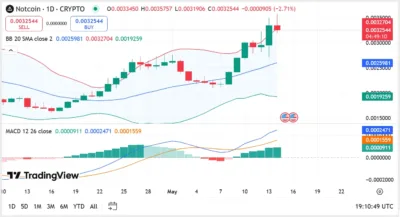
Notcoin failed to push through a key resistance level after touching a high of $0.0035757. The digital asset quickly pulled back to close at $0.0032544, signaling a sharp drop of 2.71% as selling pressure intensified.
The latest price movement follows a strong rally in late April, but momentum has shifted. Bulls could not sustain their upward push after reaching the resistance zone near $0.00327, which has now proven difficult to break.
Moreover, the daily chart reveals a bearish engulfing pattern forming at the top of the trend. This reversal signal strengthens concerns that the uptrend could lose steam after multiple days of upward movement.
Also Read: XRP Comeback Sparks RLUSD Meltdown—$44M Trading Volume Wiped Out
Resistance Proves Too Strong as Indicators Signal Weakness
Technical indicators also reflect weakening momentum, as the MACD line remains above the signal line but the narrowing gap suggests a potential bearish crossover if the trend continues in the coming sessions.
In addition, the Bollinger Bands show a widening formation, indicating rising volatility. The price could not sustain the level around the upper band at $0.0032704, confirming the resistance.

Source: Tradingview
The 20-day simple moving average at $0.0025981 is still essential to monitor. If the selling continues, Notcoin may re-touch this level soon. A break below it would signal a broader correction phase.
Trading volume also starts signaling an early retreat. The buying strength underpinning the rally is waning, and sellers are taking over the intraday action.
Conclusion
Notcoin’s failure to break through its resistance has triggered immediate downside pressure. With weakening momentum and rising volatility, the market could see a continued pullback if bulls don’t reclaim control quickly.
Also Read: XRP Suffers Shocking Liquidation Surge, Outpacing Bitcoin by Huge Margin
