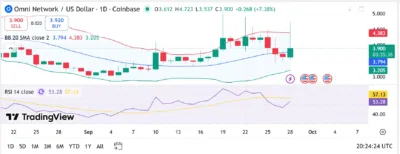
- OMNI’s Bollinger Bands expand, signaling volatility and potential price surge.
- RSI neutral, but buying pressure suggests continued upward momentum for OMNI.
- OMNI’s resistance at $4.383; breakout could push price toward $5.00.
Omni Network (OMNI) has recently made significant strides in the cryptocurrency market, currently trading at $3.90 after a notable surge of 7.38% in the past 24 hours. This price movement is part of a broader bullish trend for the token, driven by increased market interest and optimism. In this article, we analyze the key technical indicators, support and resistance levels, and provide a price forecast for the years 2025–2029.
Also Read: Plasma (XPL) Price Prediction 2025–2030: Will XPL Hit $24.00 Soon?
Recent Price Action
Omni Network’s recent surge has resulted in a sharp rise to $3.90, marking a strong upward movement. As of the latest data, Omni has achieved a remarkable 7.38% daily gain. The breakout has seen the token trade above its 20-day moving average (SMA) and Bollinger Bands, suggesting a potential bullish trend.
Technical Analysis
Bollinger Bands
The price action has pushed OMNI above the upper Bollinger Band, indicating heightened buying activity. The bands, which had been relatively narrow in recent weeks, are now expanding, signaling an increase in volatility. This could suggest that OMNI is entering a new phase of significant price movement, with potential for further upside in the near future. The current lower Bollinger Band stands at $3.205, and the upper band at $4.383. If OMNI maintains this momentum, it could push toward the $4.50–$5.00 range.
RSI Behavior
The Relative Strength Index (RSI 14) currently sits at 53.28, indicating a neutral stance with moderate buying pressure. However, as the price moves higher, there could be a risk of an overbought condition. If RSI exceeds the 70-level, we may see some pullbacks as traders secure profits. Nonetheless, the RSI’s steady performance signals sustained buyer interest, which could help OMNI continue its upward momentum in the months ahead.
Support and Resistance Levels
The immediate support for OMNI is found at $3.794, which aligns with the 20-day SMA. This is the level to watch if the price faces downward pressure. If it falls below this level, the next strong support zone is around $3.205, as indicated by the lower Bollinger Band.
On the upside, OMNI faces resistance at the $4.383 mark (upper Bollinger Band). If the price breaks above this level, it could experience a rally toward $5.00, which would be a key psychological milestone.

Source: Tradingview
Omni Network Price Prediction 2025–2029
| Year | Minimum Price | Average Price | Maximum Price |
| 2025 | $3.00 | $4.00 | $5.00 |
| 2026 | $4.20 | $4.80 | $6.00 |
| 2027 | $5.00 | $6.00 | $7.50 |
| 2028 | $6.00 | $7.00 | $8.50 |
| 2029 | $7.00 | $8.50 | $10.00 |
2025
The current momentum for OMNI suggests that the token could maintain an upward trajectory within the $3.00 to $5.00 range for the remainder of 2025. With strong DeFi market growth and a bullish market sentiment, the price could test higher levels, especially if positive news or fundamental developments emerge.
2026
In 2026, as OMNI gains more traction in the DeFi and blockchain sectors, it could hit an average price of $4.80. The $5.00 mark might serve as a critical resistance level. With additional partnerships and increased liquidity, OMNI has the potential to reach $6.00.
2027
By 2027, OMNI could be positioned to stabilize around $6.00, with upward potential toward $7.50. The continued growth in decentralized finance and blockchain adoption would help push OMNI toward these higher price targets.
2028
In 2028, if OMNI sees further integration into major DeFi protocols and more institutional interest, the token could hit $7.00–$8.50. Increased adoption and the wider use of blockchain technology could be key drivers for this growth.
2029
By 2029, Omni Network could be on the verge of breaking the $8.50–$10.00 barrier, as it establishes itself as a prominent player in the DeFi space. Institutional investments and global adoption of blockchain technology could propel OMNI to new heights.
Conclusion
Omni Network (OMNI) has shown promising technical indicators, with the breakout above the Bollinger Bands signaling a potential continuation of the bullish trend. Although there might be short-term fluctuations due to overbought conditions, the long-term outlook for OMNI remains strong. With continued growth in the DeFi sector, OMNI is well-positioned to reach new all-time highs, with a possible $5.00 target in the near future.
FAQs
1. Why did OMNI surge recently?
The recent surge in OMNI’s price was driven by strong buying pressure, as indicated by the price moving above both the 20-day moving average and the upper Bollinger Band.
2. Is OMNI overbought right now?
With an RSI of 53.28, OMNI is in a neutral range, indicating that there is still room for growth. However, if the RSI continues to rise significantly, the token could face overbought conditions.
3. What’s the next key resistance level?
The next major resistance for OMNI is around $4.383, with a potential rally toward $5.00 if buying pressure persists.
4. Could OMNI reach $10.00 in this cycle?
Yes, if the DeFi sector continues to expand and OMNI gains further adoption, reaching $10.00 by 2029 is a realistic possibility.
5. Is OMNI a good long-term investment?
With its solid technical foundation and promising growth in the DeFi ecosystem, OMNI presents a potentially strong long-term investment opportunity.
Also Read: Cardano (ADA) Price Prediction 2025–2030: Will ADA Hit $1.00 Soon?
