- PEPE stages breakout after weeks of downside pressure
- Clean break above $0.00001130 flips resistance into support
- Bulls now eye $0.00001350 and beyond as momentum builds
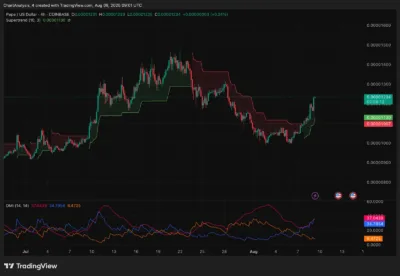
PEPE has mounted an impressive two-day rally, climbing to $0.00001233 after breaking out from a descending trendline that has limited rallies since late July. The move cleared the $0.00001130 and $0.00001200 resistance levels, setting up a possible push toward the $0.00001320–$0.00001350 zone.
Market structure has become more favorable for bulls, with all major EMAs (20/50/100/200) flipping into a bullish alignment. This rally is being fueled by modest but notable on-chain accumulation — roughly $51,197 in net inflows over the last 24 hours.

Source: Coinglass
Also Read: Lido Staked Ether (stETH) Price Prediction 2025–2029: Can Lido stETH Hit $4,000 Soon?
Technical Indicators Support Bullish Outlook
Daily and intraday charts show a broad shift toward bullish momentum. In the 4-hour chart, PEPE is trading above the upper Bollinger Band, which indicates there is a lot of buying pressure. The breakout was on increasing volume, suggesting conviction as opposed to a low-liquidity spike.
The 20 EMA on the 4-hour chart is currently at $0.00001129, and it is providing dynamic support. Confirming the trend, the DMI shows +DI in the lead and ADX climbing toward 35, suggesting a strengthening bullish environment. The daily Parabolic SAR is well below the price, which is further evidence of the upside thesis.

Source: Tradingview
The daily MFI at 45.93 shows that there is still space before reaching overbought extremes, and as long as there is market momentum, there is the possibility of another leg up.
Resistance Test May Establish Trend of 2025
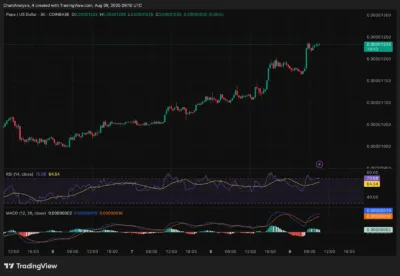
The RSI on the 30-minute chart is around 70 (slightly overbought), so short-term pullbacks are possible, but MACD is still in a bullish crossover. The 4-hour Supertrend has turned bullish at 0.00001130, augmenting the breakout bias.
Should price break the resistance range of $0.00001320 to $0.00001350 with substantial volume, a move to the levels of $0.00001450 and maybe even $0.00001550 will become more probable.

Source: Tradingview
The negative is that a loss of the $0.00001200 level threatens to retest the previous support at $0.00001130; a break lower would reverse the short-term bias to bearish and potentially target the $0.00001050-$0.00000985 demand.
PEPE Price Forecast 2025–2030
| Year | Minimum ($) | Average ($) | Maximum ($) |
| 2025 | 0.00000985 | 0.00001240 | 0.00001550 |
| 2026 | 0.00000950 | 0.00001320 | 0.00001700 |
| 2027 | 0.00001080 | 0.00001450 | 0.00001950 |
| 2028 | 0.00001200 | 0.00001600 | 0.00002200 |
| 2029 | 0.00001350 | 0.00001820 | 0.00002550 |
| 2030 | 0.00001500 | 0.00002050 | 0.00002800 |
Year-by-Year Outlook
2025
PEPE is still at the beginning of a breakout, and the primary support block is at $0.00001200- $0.00001130. Once it has broken out confirmed above $0.00001350, then the price could reach $0.00001550 by the end of the year.
2026
If the current bullish structure is preserved and the $0.00001300-$0.00001320 range turns into long-term support, PEPE might average at $0.00001320 and even move up to $0.00001700.
2027–2028
Further, the strength of the memecoin market may see PEPE hit $0.00001950 in 2027 and $0.00002200 in 2028. It will be essential to keep higher lows above $0.00001080.
2029–2030
Provided that the adoption and market cycles are not stagnant, PEPE might reach the $0.00002550 price point in 2029 and $0.00002800 in 2030 under the assumption of consistent accumulation and trend persistence.
Conclusion
The breakout has created new hope amid weeks of selling pressure in PEPE. This rally is being supported by bullish technical alignment, positive on-chain inflows, and improving trend indicators.
Holding above $0.00001200 keeps the bullish structure intact, while a breakout over $0.00001350 could ignite the next leg toward $0.00001550. Traders should watch for volume confirmation and protect against reversals below $0.00001130.
FAQs
1. Is PEPE going bullish?
Yes. The break above $0.00001130 and bullish EMA alignment indicate early-stage trend reversal potential.
2. Where is the next significant resistance?
The key hurdle is the $0.00001320–$0.00001350 zone. Clearing it could unlock $0.00001450–$0.00001550.
3. Where is the best support?
Immediate support lies at $0.00001200, with $0.00001130 as the breakout base.
4. Will PEPE move to $0.00001550 by year-end?
It’s possible if $0.00001350 is broken with high volume and structure holds above $0.00001200.
5. What is behind PEPE’s revival?
Trendline breakout, on-chain inflows, EMA bullish alignment, Parabolic SAR support, and strengthening DMI/ADX readings.
Also Read: Binance Coin (BNB) Price Prediction 2025–2029: Can Binance Coin (BNB) Hit $1,000 Soon?
