- Fibonacci targets show XRP market cap may soon triple upward.
- Analysts confirm XRP breakout structure aligning across multiple charts.
- Key resistance at $3.65 could trigger massive upward momentum.
XRP is approaching a critical juncture as multiple technical analysts identify signs pointing to a major breakout. With price action holding firm above $3.50 and recording a weekly gain of more than 23 percent, bullish momentum continues to build.
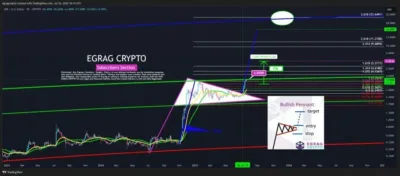
According to EGRAG CRYPTO, XRP’s current market structure mirrors the early stages of a five-wave Elliott Wave pattern. The chart posted on X shows a forecasted swing on the waves (3) and (5), with powerful Fibonacci objectives.
These targets indicate a possible range of $308 billion in the market capitalization of XRP at the Fibonacci level of 1.272, $488 billion with the level 1.414, and $946 billion with the Fibonacci level of 1.618. Each level represents a milestone in the expected continuation of the breakout.
#XRP – Market Cap Analysis: Choose Your Fib Targets! 📊:
Fibonacci targets:
▫️Fib 1.272: $308 Billion 💰
▫️Fib 1.414: $488 Billion 📈
▫️Fib 1.618: $946 Billion 🌟
Each of these targets represents potential milestones for #XRP’s market cap. Which one are you aiming for?… pic.twitter.com/IWza7y5fV5
— EGRAG CRYPTO (@egragcrypto) July 23, 2025
Egrag added that each of these levels is a potential milestone for XRP market cap, where the price of the token could reach notable heights not achieved before.
Also Read: ‘SWIFT’s Last Sunset, XRP is the Back Up Plan’ – Pundit Explains
EGRAG Highlights Key Fibonacci Targets and Elliott Wave Projection
Another chart shared by EGRAG CRYPTO offers a detailed look at XRP’s long-term market cap projection using Fibonacci extension levels.
According to this projection, wave (3) aligns with a market capitalization target of approximately $488 billion, while wave (5) could potentially reach $946 billion, based on the 1.618 Fibonacci level. An earlier milestone at $308 billion represents the 1.272 level.
Corresponding price targets are $5.37, $6.26, and a full extension to $23.64. These levels reflect XRP’s long-term breakout path.
These targets outline the potential upside if the bullish structure continues to unfold as expected. For this scenario to remain valid, XRP must maintain strong support above the $3.13 and $2.60 zones.

Source: EGRAG CRYPTO
The triangular structure on the chart also confirms the presence of a bullish pennant that has been building over recent months. A decisive move above $3.65 is now viewed as the key trigger to validate this breakout, with XRP expected to challenge new all-time highs and approach the upper boundary of the broader ascending channel.
Other Analysts Confirm Bullish Momentum and Near-Term Targets
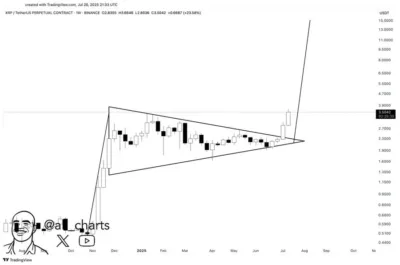
Ali Martinez, a respected crypto analyst, observed a breakout from a weekly bullish flag pattern. He believes the breakout from this formation, supported by strength above $2.70, sets XRP on a course toward $15 in the longer term. This projection is pegged on the height of flagpoles, which is dependent on XRP’s ability to maintain its support levels.

Source: Ali-Chart
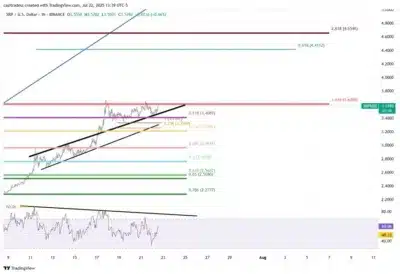
In the meantime, CasiTrades referred to the recent clean consolidation of XRP between $3.40 and $3.60. This has triggered bullishness, which is supported by the fact that the trendline, which was a significant resistance, is now in favor of the bulls.

Source: CasiTrades
The Relative Strength Index is still not against the level of overbought; it can be higher to give it more points of advancement. Any break above $3.66 may result in an instant push towards the $4.65 mark. In case of a draw-back, the $3.25-$3.20 range could provide short-term support.
Conclusion
Several independent analyses are now pointing in the same direction — a significant XRP breakout could be underway. With aligned technical structures, confirmed support levels, and defined market cap targets, XRP is approaching a potential rally phase that may reshape its price action in the months ahead.
Also Read: Bitwise ETF Conversion Including XRP Halted by SEC – What is Going On?
