


What to Know
- Shiba Inu fell roughly 10% from its local peak, returning to the 200-day moving average that its breakout had cleared.
- Buyers responded near $0.00000555, but sellers between $0.0000060 and $0.0000063 still limit SHIB’s attempts to recover its lost ground.
- A sustained drop below $0.0000056 would weaken the recovery, with chart support near $0.0000054 and shorter moving averages below.
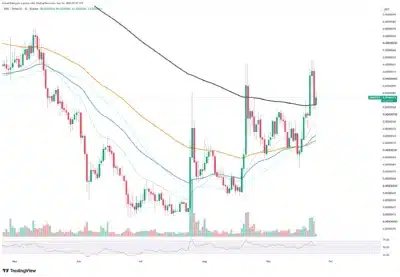
Shiba Inu (SHIB) has returned to its 200-day moving average after a rapid reversal erased much of its recent breakout. The token briefly exceeded $0.00000620 before falling about 10% from its local peak and retreating toward $0.0000056.
The decline places SHIB near $0.0000056 to $0.0000057, an area that had restricted its advances for months. The breakout came with higher trading volume, suggesting buyers initially had enough strength to challenge the broader trend.
However, selling intensified once SHIB crossed $0.0000060, pushing the token back toward the level it had just cleared. The reversal indicates that holders remain willing to sell between $0.0000060 and $0.0000063, despite the earlier rise in volume.
Also Read: XRP ETFs Draw $18 Million as Token Falls, but $2 Billion Asset Milestone Remains Unclear
SHIB’s Moving Average Becomes the Key Test for Buyers
SHIB traded near $0.00000573 in the referenced chart, leaving the price slightly above the 200-day moving average. Moreover, the latest daily candle showed buying interest as the token approached $0.00000555 during its initial retreat.
We're back on X.
— 36Crypto (@36Crypto1) August 21, 2026
Our previous account (36crypto2) is currently unavailable while we continue working through the appeal process. In the meantime, this is our new official account. While you are on this page, please support us by sharing and following.
Those reactions make the $0.0000055 to $0.0000057 range central to whether the breakout remains technically viable. If buyers defend the area and lift SHIB above $0.0000058, the decline could become a retest of former resistance.
A recovery would bring $0.0000060 back into view, while $0.0000062 would present another obstacle for buyers. Still, the swift rejection above $0.0000060 shows that reclaiming those prices requires more sustained demand than the initial breakout produced.
Source: TradingView
Conversely, a clear move below the 200-day average would undermine the recent improvement in SHIB’s chart structure. The next visible support lies near $0.0000054, followed by shorter moving averages clustered around $0.0000051 to $0.0000052.
Momentum has weakened alongside the pullback, with the relative strength index returning toward the middle of its range. Although the retreat eased overbought conditions, it also reflected reduced buying pressure following SHIB’s brief surge above resistance.
SHIB therefore faces a direct test at the former breakout level, where buyers have shown an initial response. Holding $0.0000056 would preserve the recovery setup, while sustained trading below it would strengthen the failed-breakout case.
Also Read: Zcash Cofounder Says Privacy and Quantum Security Must Be Easy to Use
