Shiba Inu (SHIB) is making headlines again as the token attempts to break out of its recent consolidation zone. As of May 26, 2025, SHIB is trading at $0.00001469, showing modest bullish momentum following a strong bounce from local support near $0.00001408. The memecoin, which has historically traded in high volatility cycles, now approaches a decisive resistance band between $0.00001483 and $0.00001500, where a breakout could set the tone for the next leg of upward movement.
Recent price action reflects a broader recovery pattern across memecoins, with SHIB showing resilience despite mixed technical signals. If the bulls clear the resistance level, SHIB could surge toward $0.00001592, with longer-term projections targeting highs near $0.00001764. However, the path forward is filled with challenges, particularly with the RSI and Stochastic RSI flashing overbought conditions, suggesting that SHIB may need consolidation before launching higher.
Also Read: PEPE Coin Price Prediction 2025–2029: Can PEPE Hit $0.000026?
Technical Analysis
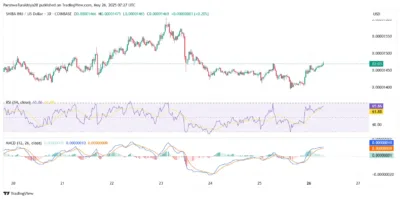
Over the past 24 hours, the rally has followed a MACD bullish crossover and renewed buyer defense of the 50% Fibonacci retracement level, which is near $0.00001396. This structure sets the basis for a recovery, mainly on lower timeframes, as the rising volume shows that the market is becoming more active.
After a tight trading period lasting about three days, SHIB has started to rise again on both 4-hour and 30-minute charts, suggesting an upward breakout is possible.
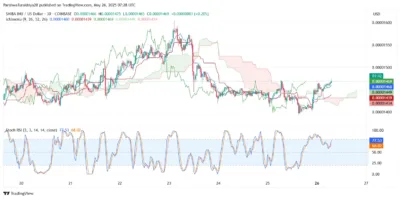
On the 30-minute chart, RSI is at 65.86, which indicates a rising bullish trend, but it is drawing near the point where prices could start falling. Meanwhile, the Stochastic RSI level is already above 77, showing a possible overbought trend. As a result, we should approach this rally with care, as new buyers are needed to drive SHIB above the critical resistance area before the rally can sustain itself.

Source: Tradingview
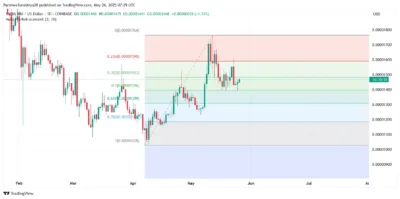
As SHIB climbs higher, it is running into a dense confluence of technical resistance levels that could determine the token’s immediate future. The 38.2% Fibonacci retracement level at $0.00001483 has acted as a ceiling for price action in recent sessions, and it now aligns with an important cluster of Exponential Moving Averages (EMAs)—specifically the 20, 50, 100, and 200 EMA lines—all positioned tightly between $0.00001455 and $0.00001467.
The problem is further compounded by the Bollinger Band midline and Ichimoku Cloud resistance, near the $0.00001459 to $0.00001469 region. When indicators line up this way, it becomes difficult for bulls to break through and confirm a real breakout. A breakout above $0.00001500 could move the token toward $0.00001592 and may even reach $0.00001764, the upper limit of the symmetrical triangle charted on the daily chart.

Source: Tradingview
Should SHIB fail to increase here, its momentum may fade, sending the price to lower areas. $0.00001408 is a potential target in a correction, and if market trends are especially bearish, SHIB could revisit $0.00001309 and meet the strong support level at the 61.8% Fibonacci retracement.
Shiba Inu Price Prediction Table: 2025–2029
| Year | Minimum Price | Average Price | Maximum Price |
| 2025 | $0.00001300 | $0.00001500 | $0.00001760 |
| 2026 | $0.00001450 | $0.00001800 | $0.00002200 |
| 2027 | $0.00001700 | $0.00002100 | $0.00002650 |
| 2028 | $0.00002000 | $0.00002500 | $0.00003100 |
| 2029 | $0.00002400 | $0.00003000 | $0.00003800 |
Year-by-Year Breakdown
2025
SHIB is staging a technical recovery following consolidation, but the outcome largely depends on whether bulls can reclaim the $0.00001500 level. If successful, SHIB could close the year near $0.00001760, provided broader crypto sentiment remains favorable.
2026
By 2026, SHIB may benefit from improved market structure and increased adoption of Ethereum-based memecoins. With continued community engagement and meme culture momentum, SHIB could average around $0.00001800, with potential highs of $0.00002200.
2027
If usage grows and SHIB sees integration with platforms or retail environments, the price may approach $0.00002650. A strong base of long-term holders and ecosystem expansion could support this trajectory.
2028
SHIB’s performance will likely depend on real-world utility, NFT integration, or Layer-2 adoption. If Shibarium or similar projects gain traction, price levels could reach up to $0.00003100, with consistent interest in decentralized applications.
2029
By 2029, SHIB could mature into a widely recognized digital asset within the meme economy. Speculative cycles and broader adoption may push the price to a peak near $0.00003800, assuming no major market disruptions occur.
Conclusion
The near-term dynamic suggests Shiba Inu is about to challenge a significant price zone, as rising momentum and support near $0.00001408 are pushing SHIB to break through the strong resistance at $0.00001500. Should Shiba Inu surge here, it could jump to $0.00001592, while longer-term views may even reach $0.00001764.
Between 2025 and 2029, SHIB is expected to be a coin with high rewards and risks. It continues to evolve mainly because of new technologies, practical tools, and the involvement of its community members. When memecoins move past the hype phase to practical applications and branding, SHIB can lead in the meme asset sector.
FAQs
1. Why is Shiba Inu going up today?
Technical indicators like the MACD and price support near $0.00001408 fuel a short-term recovery, with bulls pushing toward key resistance at $0.00001500.
2. What happens if SHIB breaks above $0.00001500?
A breakout could trigger a rally to $0.00001592 and potentially $0.00001764, confirming a bullish continuation from the symmetrical triangle.
3. Is SHIB still at risk of pulling back?
The RSI and Stochastic RSI show near-overbought conditions and Failure to break resistance could lead to a dip back toward $0.00001309.
4. Can SHIB reach $0.000030 in the long run?
If adoption grows and the community remains strong, SHIB could target $0.000030 by 2029, especially during favorable altcoin cycles.
5. What are the key levels to watch now?
Watch for support at $0.00001408 and resistance at $0.00001483–$0.00001500. A clean breakout above this range is vital for further upside.
Also Read: Mysterious Wallet Receives $45M in DOGE From Robinhood-Linked Account

