- Shiba Inu trades near $0.00000973, struggling to reclaim lost momentum amid strong selling pressure.
- Price remains below key EMAs, with resistance forming a dense cluster above $0.00001068.
- Persistent exchange outflows signal distribution, while a breakout above $0.00000990 could hint at reversal potential.
Shiba Inu (SHIB) continues to struggle beneath a dominant descending trendline, trading around $0.00000973 as sellers retain control over short-term momentum. Multiple rebound attempts have failed to push the price beyond key moving averages, leaving the meme-inspired token confined within a bearish channel. With spot outflows rising and technical indicators pointing to persistent weakness, the coming sessions could determine whether SHIB finds relief or extends its downtrend.
Also Read: Dogecoin (DOGE) Price Prediction 2025–2030: Can DOGE Reach $0.24 Soon?
Downtrend Intact as Moving Averages Flip Into Resistance
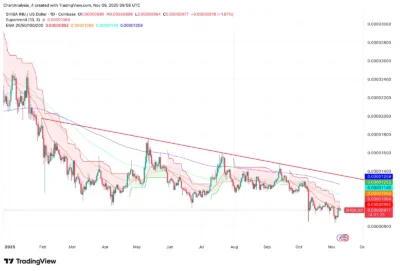
The daily chart shows SHIB trapped under a descending trendline that has rejected every breakout attempt since January. The token remains below all major exponential moving averages the 20-day EMA at $0.00001068, 50-day EMA at $0.00001069, 100-day EMA near $0.00001149, and 200-day EMA around $0.00001259.
This alignment forms a formidable resistance zone, compressing SHIB’s ability to rally. The Supertrend indicator continues to flash red, confirming the dominance of sellers. Until the token closes decisively above the 20-day EMA, each upward move is likely to be a short-lived relief rally within a larger bearish structure.

Source: Tradingview
Narrowing volatility suggests an approaching inflection point. If SHIB can reclaim the 20-day EMA, it would be the first technical signal that momentum is shifting back to buyers. Otherwise, the broader downtrend remains intact, keeping traders cautious.
Spot Outflows Highlight Ongoing Distribution
Data from Coinglass reveals persistent net outflows from wallets to exchanges, signaling that holders are positioning to sell rather than accumulate. On November 9, SHIB recorded about $100,410 in net outflows, adding to a multi-month pattern of negative flows.
When price hovers near support amid rising outflows, it often indicates distribution — the process of long-term holders offloading tokens into market strength. This ongoing movement of SHIB to exchanges reflects weak holder conviction and limited demand from new entrants.
Unless these flows begin to reverse, upward momentum will remain constrained. Sustained accumulation and reduced exchange supply would be essential to underpin any meaningful bullish reversal in the weeks ahead.
Short-Term Channel Reflects Weak Rebounds
On lower timeframes, SHIB trades within a descending channel characterized by lower highs and lower lows. The price is currently attempting to stabilize near the channel’s midpoint but faces consistent rejection along the upper boundary.
Momentum remains muted, with Parabolic SAR dots appearing above price candles and the RSI on the 30-minute chart hovering near 42 — both indicators reinforcing the bearish bias. For SHIB to display renewed strength, it must break through the $0.00000990 level, which represents both immediate resistance and the upper limit of the short-term channel.
Failure to do so could lead to a retest of $0.00000930, a key support zone. A breakdown below this level would expose the next liquidity pocket near $0.00000880, deepening the ongoing corrective phase.
Outlook: Will Shiba Inu Go Up?
Shiba Inu’s price action has tightened into a range that hints at an impending decisive move. A bullish breakout above $0.00000990, followed by a confirmed close over $0.00001068, could mark the start of a short-term reversal. This would open a potential path toward $0.00001250 and eventually $0.00001400, where major trendline resistance capped previous rallies.
Conversely, a bearish breakdown below $0.00000930 would affirm that sellers remain in command, likely dragging SHIB toward $0.00000880 the next demand zone observed earlier in the year. Until price breaks this compression decisively, the market remains neutral-to-bearish, with rallies more likely to be sold than extended.
Shiba Inu Price Prediction 2025–2030
| Year | Minimum ($) | Average ($) | Maximum ($) |
| 2025 | 0.0000085 | 0.000010 | 0.000013 |
| 2026 | 0.000010 | 0.000012 | 0.000015 |
| 2027 | 0.000012 | 0.000014 | 0.000018 |
| 2028 | 0.000015 | 0.000017 | 0.000021 |
| 2029 | 0.000018 | 0.000020 | 0.000025 |
| 2030 | 0.000020 | 0.000024 | 0.000030 |
Year-by-Year Outlook
2025
Shiba Inu is expected to trade between $0.0000085 and $0.000013 as it works to stabilize following its prolonged decline. A sustained breakout above $0.00001068 could trigger a short-term recovery phase.
2026
If overall market sentiment improves and liquidity returns to altcoins, SHIB may retest $0.000015, suggesting the start of a mid-term bullish reversal supported by renewed demand.
2027
Growing adoption of Shibarium and the expansion of Shiba Inu’s DeFi ecosystem could drive prices toward $0.000018, marking a stronger recovery phase supported by increased on-chain activity and token burns.
2028
As utility strengthens, integration within broader crypto applications could help SHIB test $0.000021, supported by community engagement and improving network fundamentals.
2029–2030
Assuming sustained network growth and broader market participation, SHIB could stabilize between $0.000024 and $0.000030, completing a multi-year recovery cycle.
Conclusion
Shiba Inu’s short-term outlook remains cautious, with price action still dominated by sellers and capped beneath key moving averages. Persistent outflows from holders to exchanges confirm ongoing selling pressure, while weak volume underscores the lack of bullish conviction.
A breakout above $0.00000990 would be the first indication that buyers are regaining control, with confirmation coming only if SHIB can close above $0.00001068 and sustain that level. On the downside, losing support at $0.00000930 would likely extend the bearish trend toward $0.00000880.
Shiba Inu remains in a consolidation phase a market waiting for direction. Whether the next move is a breakout or breakdown will depend on whether bulls can generate the volume and conviction to overcome the heavy resistance overhead.
FAQs
1. Why is Shiba Inu’s price fluctuating near $0.00000970–$0.00001000?
SHIB is consolidating beneath a descending trendline, with overhead resistance at its 20-day EMA and support forming near $0.00000930.
2. What do recent outflows suggest?
Exchange data showing net outflows of over $100,000 on November 9 indicates that more tokens are moving to exchanges, suggesting potential selling pressure.
3. What are the major resistance levels to watch?
Key resistance zones lie near $0.00000990, $0.00001068, and $0.00001250. Clearing these levels would signal the beginning of a potential trend reversal.
4. What happens if Shiba Inu drops below $0.00000930?
A confirmed breakdown below this support would expose SHIB to the next liquidity pocket near $0.00000880, extending its bearish trajectory.
5. When will Shiba Inu confirm a bullish breakout?
A daily close above $0.00001068, accompanied by rising trading volume and sustained positive inflows, would mark the first sign of a bullish trend shift.
Also Read: Liquid Staked ETH Price Prediction 2025–2029: Will stETH Hit $5,000 Soon?

