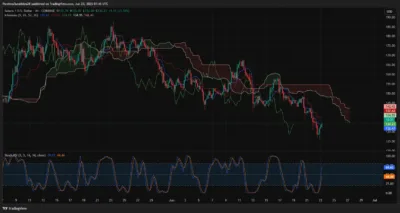
Solana is attempting a recovery after a recent liquidity sweep brought prices down to the $124 range. As of June 23, the asset trades near $134.20, rebounding from short-term demand levels observed earlier in the week.
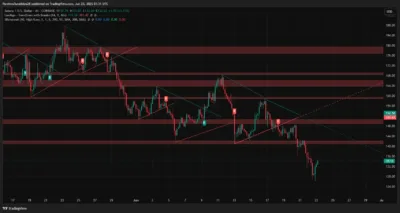
Recent price action shows a bounce from $124.08, a key area of support aligned with earlier trendline touches and fair value gaps. Buyers have stepped in, supported by short-term indicators showing defensive strength around this zone.
Despite the rise, Solana is still confined by a resistance cluster between $135.50 and $138.80. This range encompasses several exponential moving averages in the 4-hour chart combined with previous liquidity highs, and thus, it becomes major resistance to the upward direction.
Source: Tradingview
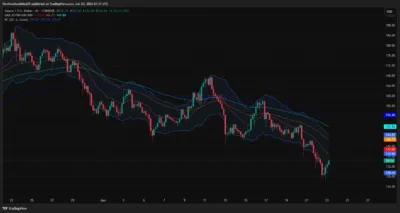
The 4-hour time illustrates the indicators of volatility, as the price has just changed character at $132.40. A structural break was authenticated at approximately $134.50, which has attracted buyers’ attention, including at the current prices.
Buyers continue to face supply blocks that emerged around $138, which align with previous equilibrium highs and institutional activity. The Bollinger and Keltner channel momentum indicators are compressing, which indicates probable volatility in the subsequent sessions.
Source: Tradingview
Also Read: Metaplanet and Cardone Capital Spark Global Rush for Bitcoin Reserves
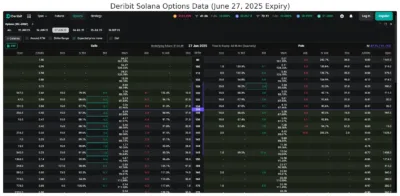
Options Data Reflects Uncertainty, With Slight Bullish Tilt Above $135
According to Deribit options data for the June 27 expiry, traders are positioning for a potential breakout. Call options between $134 and $140 are heavily stacked, with substantial open interest at the $135 strike.
Implied volatility is averaging above 87 percent, suggesting that traders expect a sharp move before the expiry date. Elevated premiums on the put side indicate continued demand for downside protection near the $125 level.
Source: Deribit
The market structure indicates support has built up at prices around 128 and 124, which had previously experienced selling pressure. The volume analysis shows that buyers are trying to defend these areas as they continue to be rejected at levels above $143.77.
Based on real-time indicators on the 30-minute chart, Solana is trading above its volume-weighted average price. The parabolic SAR also turned bullish, and this will support around 133.38 dollars.
The Ichimoku has additional resistance, and the Kijun line around the price of 134.95 and the flat span A at plus 142 potentially attract prices. To verify an extension towards 144 and 151.50, the price must remain above 138 and reverse into support.
Solana’s intraday recovery has drawn strength from key demand areas but remains fragile under layered resistance. With volatility tightening and options data signaling a possible breakout, traders will closely watch whether bulls can overcome the $138 hurdle in the coming sessions.
Also Read: XRP Holds Steady Above Key Support as Analysts Eye Potential July Breakout
