The SPX6900 token, a meme cryptocurrency created purely for entertainment, is designed with no affiliations to equities or securities. Any association with the “stock market” is coincidental and intended as satire. Despite its humorous premise, SPX6900 has attracted significant interest due to its potential price movements.
Also Read: Gas (GAS) Price Prediction 2025-2029: Will GAS Price Hit $15 Soon?
Bollinger Bands Analysis of SPX6900
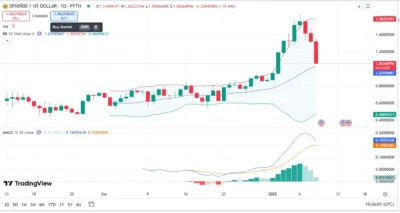
Bollinger Bands provides critical insights into SPX6900’s price dynamics. The chart reveals widened Bollinger Bands, highlighting increased volatility and active market participation.
In December 2024, the token was trading within a relatively stable range, exhibiting a zig-zag pattern. However, starting in January 2025, the price began surging significantly, moving beyond the upper Bollinger Band.
The token often interacts with the upper border, indicating demand exhaustion, which typically leads to price reconciliation. However, the widened bands suggest a potential for further upward movement.
The recent price correction seen on the chart aligns with typical overbought conditions. Buyers appear to be re-evaluating, allowing for stabilization near the middle Bollinger Band before the next move.
Relative Strength Index (RSI) Analysis
The Relative Strength Index (RSI) on the chart indicates an overbought condition, with a value exceeding 70 during the January price rally. Currently, the RSI has likely moderated following the recent correction. Overbought levels often signal a pullback, and this behavior is evident in SPX6900’s recent price action.
While the RSI reached its peak during the surge, the current leveling of the Simple Moving Average (SMA) suggests a cooling-off period. This moderation could lead to a period of consolidation or preparation for the next upward move, depending on market sentiment.
SPX6900 Price Analysis Using MACD
The Moving Average Convergence and Divergence (MACD) indicator provides further evidence of bullish momentum. The chart shows the MACD line crossing above the signal line, accompanied by prominent green histogram bars. The MACD value of 0.1659 supports the token’s above-average performance.
Although the histogram is beginning to shrink as the market corrects, the MACD line remains above the signal line, indicating residual buying momentum. This suggests that SPX6900 still has the potential for recovery and future gains.

Source: Tradingview /Bollinger and MACD
Read Also: XDC Network (XDC) Price Prediction 2025-2029: Will XDC Price Hit $0.35 Soon?
SPX6900 (SPX) Price Prediction – Resistance and Support Levels
The chart indicates key support and resistance levels for SPX6900. The $1.00 level served as a significant resistance point before the January rally, with SPX breaking through and testing highs near $1.50. However, the correction brought the price closer to the middle Bollinger Band, suggesting support around $1.00.
Future resistance levels are anticipated near $1.50 and $2.00, while strong support is likely to remain around $0.80 to $1.00, ensuring stability during bearish phases.
SPX6900 Price Predictions for 2025-2029
| Year | Minimum Price | Average Price | Maximum Price |
| 2025 | $2.00 | $3.50 | $5.00 |
| 2026 | $1.50 | $2.85 | $3.50 |
| 2027 | $1.75 | $3.75 | $6.50 |
| 2028 | $4.00 | $5.00 | $7.50 |
| 2029 | $9.00 | $15.00 | $18.00 |
2025
SPX6900 is anticipated to continue its bullish rally, with price predictions ranging from $2 to $5. The average price is expected to stabilize around $3.50.
2026
A bearish phase may cause a price dip, with the token trading between $1.50 and $3.50. The average price is predicted to be $2.85.
2027
Recovery from bearish sentiment could see SPX6900 consolidating between $1.75 and $6.50, with an average of $3.75.
2028
The Bitcoin halving event could spark market-wide optimism, pushing SPX6900 prices between $4 and $7.50, averaging around $5.
2029
A significant bull run is projected to drive SPX6900 prices to new heights, with values ranging from $9 to $18 and an average of $15.
Conclusion
SPX6900, while a meme token, has demonstrated significant market activity and potential for growth. Analyzing technical indicators such as Bollinger Bands, RSI, and MACD highlights its bullish momentum, supported by strong buying interest and widening price bands. Price predictions for 2025-2029 reflect a mix of bullish and bearish phases, with the token likely achieving steady growth over time.
FAQs
What is SPX6900, and what does it represent?
SPX6900 is a meme token created for entertainment and parody purposes without affiliation to equities or securities.
What does the Bollinger Bands analysis suggest about SPX6900?
Bollinger Bands shows SPX6900 is experiencing widened price ranges, with frequent tests of the upper band indicating bullish momentum.
What is SPX6900’s RSI value, and what does it signify?
SPX6900’s RSI is 78, suggesting overbought conditions due to high buying activity and the potential for price pullback.
How does MACD analysis reflect SPX6900’s market performance?
MACD analysis shows a positive trend, with increasing green histogram bars and bullish momentum for SPX6900.
What are the key support and resistance levels for SPX6900?
Support is around $0.68, while resistance levels are projected near $3 and $5, based on recent price movements.
Also Read: Binance Coin (BNB) Price Prediction 2025-2029: Will BNB Price Hit $1,800 Soon?
