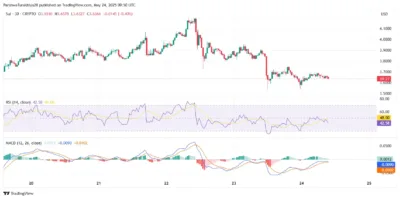
SUI is trading around $3.63, facing mild bearish pressure after failing to hold its position above $4.00 earlier this week. The altcoin has pulled back from its May highs, and recent price behavior has transitioned into a descending wedge structure. While this has limited immediate upside, the broader picture suggests the possibility of a longer-term recovery if key support levels continue to hold. With the market now eyeing the future, long-term projections for SUI are beginning to take shape.
Also Read: Ethereum Price Prediction 2025–2029: Can ETH Hit $6000 Soon?
Technical Analysis
After failing to break through $4.20, there are signs that the current movements in the SUI market are uncertain. A reset in momentum indicators is now evident, meaning we may soon find out if the current market movement ends in a drop or the start of a new upward trend.
On the 30-minute MACD, selling pressure has weaker support than earlier, yet the histogram is still negative. Neither the signal nor the MACD line shows much movement, indicating that uncertainty is still present. In the long run, MACD has often flipped directions near support areas before a positive turn began. It follows that SUI might climb if the trend toward buying continues in the days to come.

Source: Tradingview
Right now, the RSI of 42.5 suggests there’s a slight bearish shift, yet the market is not oversold. For most of the week, the RSI has stayed near 40 and 50, suggesting the market is not ready to fall sharply. If the RSI goes above 50, it may be an early sign that investor confidence is bolstering stocks and starting a new bull trend.
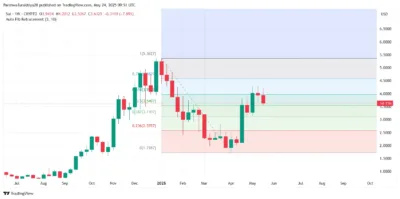
Critical points are easily identified using Fibonacci levels, with $3.91—corresponding to the 0.618 retracement level between $5.36 and $1.71—acting as a recent market ceiling. Meanwhile, the price supports on FXCM at $3.54 and $3.11 are attracting buyers today. Fibonacci levels are still significant in guiding the market’s emotions and probable reaction zones.

Source: Tradingview
SUI Price Prediction Table (2025–2029)
| Year | Minimum Price | Average Price | Maximum Price |
| 2025 | $3.80 | $5.20 | $6.70 |
| 2026 | $4.60 | $6.80 | $8.10 |
| 2027 | $5.20 | $7.90 | $9.80 |
| 2028 | $6.00 | $9.30 | $11.50 |
| 2029 | $7.10 | $10.60 | $13.40 |
Yearly Insights
2025
According to technical charts, SUI may stay above the $3.50 level, which also suggests a recovery to $6.70. With the market recovering and some gentle buying, the average price might rise to $5.20.
2026
SUI could be driven up toward $8.10 if the market opens up and confidence grows. So long as essential moving averages are below the price, the asset will likely stay bullish.
2027
Further utility and possible improvements in the ecosystem could result in more growth. If buying continues and the RSI recovers above 60, the SUI might rise to $9.80 on higher activity.
2028
If the industry matures further, prices for SUI might surge. As long as the broader trend is bullish, the 0.618 extension could bring the token towards its average price of $9.30.
2029
If SUI enters consolidation above $10, there is a chance it will rise to $13.40. Higher interest from buyers and much interest can lead to a long-term price point near $10.60.
Conclusion
Although it has closed recently at nearly $3.63, SUI is still within a range that helps its prospects for future development. The signals from MACD and RSI indicate little bear control, and Fibonacci areas are far above panic levels. As long as $3.52 and $3.11 provide support, the coin might rise over the next five years. Cryptocurrency prices may rise and fall soon, but there is support for steady improvements and rising values by 2029.
FAQs
1. What is the current support level for SUI?
SUI’s key support is $3.52, aligned with the 200 EMA and 0.5 Fibonacci retracement.
2. What resistance must SUI break to start a rally?
A break above $3.71 with substantial volume could trigger an upside toward $3.91 and $4.20.
3. Is SUI in an oversold position?
No, the RSI at 42.5 shows mild bearishness but not an oversold condition.
4. Can SUI reach double digits by 2029?
If current support levels hold and sentiment remains positive, a price above $10 is realistic.
5. What role do Fibonacci levels play in this prediction?
They help define key support and resistance zones that guide future price reactions.
Also Read: Wall Street Titan Scaramucci Backs Solana to Disrupt $7T Finance Market
