The Swarms Ecosystem, a comprehensive collection of tools and frameworks, enables developers to create and manage networks of autonomous agents across various domains. The native cryptocurrency of the ecosystem, Swarms (SWARMS), has demonstrated substantial growth and potential in the cryptocurrency market.
Also Read: AI16Z Price Prediction 2025-2029:Will AI16Z Reach $3.20 Soon?
SWARMS Price Analysis: Bollinger Bands Indicate Key Support and Resistance Levels
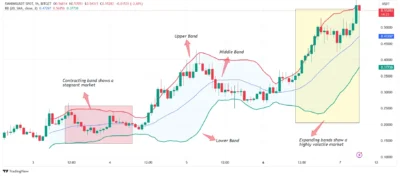
Bollinger Bands analysis suggests SWARMS is in a phase of dynamic price movement. With its price rising from $0.14 to $0.5, the token has frequently tested the upper Bollinger Band, indicating bullish momentum. During market corrections, it has often bounced at the Simple Moving Average (SMA). When SWARMS retraces to the upper band crossover, the possibility of further upside continuation is further enhanced, especially if support levels hold.
When the Bollinger Bands narrow, the price moves by a specific value, showing that the value of the market has low volatility. On the other hand, when the bands open up, the market demonstrates high turbulence, and therefore, the price oscillates widely. Since SWARMS faces the upper band, traders are waiting for more clues as to whether it will find support to continue its upward path or dual back down again.

Source: Tradingview
Relative Strength Index (RSI): Correction Signals Emerging
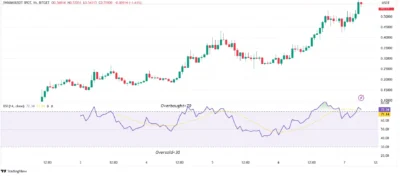
Currently, at 72, the RSI indicator indicates overbought conditions for SWARMS, suggesting the token’s price may face short-term corrections before resuming its upward trend. It is also interpreted that having a value higher than 70 means that there is a likelihood of an upsurge in buying pressure, while values below thirty mark an oversold zone. When the RSI goes below the SMA, it will indicate underperformance and provide traders with long entry points at lower prices.

Source:Tradingview
Moving Average Convergence and Divergence (MACD): Positive Momentum Continues
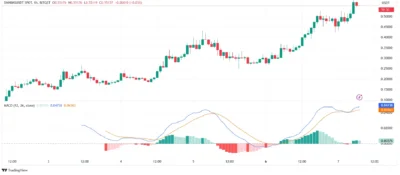
MACD analysis on SWARMS has shown this stock to have a good upward signal, which can easily translate into a trading signal. As for the MACD, the line is above the trigger line at 0.0476; therefore, a bullish response is expected. The distance of the MACD line from the SMA and the histogram with strong green spikes also simplifies that the token continues to offer performance beyond the market average. All these indicators point towards the probability of enhanced growth and development of SWARMS; thus, it’s the best time for traders and investors to tap the platform.

Source: Tradingview
Swarms (SWARMS) Price Predictions 2025-2029
| Year | Minimum Price | Average Price | Maximum Price |
| 2025 | $1.25 | $3.50 | $10.50 |
| 2026 | $1.50 | $2.50 | $4.00 |
| 2027 | $4.00 | $6.50 | $9.00 |
| 2028 | $8.00 | $10.50 | $15.00 |
| 2029 | $25.00 | $32.00 | $45.00 |
2025
In 2025, SWARMS is forecasted to trade within an ascending broadening wedge pattern, with potential corrections from the upper trendline to support levels before continuing its upward trajectory. However, if the bulls are active, more support levels can be seen shortly for SWARMS, and it noted that the average price could reach $ 3.50 during the expected bull run in 2025.
2026
After 2025 has emerged as a roaring year, the following year, 2026, is expected to pull back or perform a bear market. In this phase, SWARMS may observe a drop in support level as traders reposition themselves. During this period, the price of SWARMS is expected to be $ 2.5, and the company will likely experience some momentary setbacks.
2027
Hence, when the market emerges from a bear market, 2027 could be the year that will start the healing process slowly. At the same time, SWARMS is expected to have an average price of $ 6.50 due to due interest and more stability in the market.
2028
Due to the fundamental knowledge about the Bitcoin halving process, the expectation is that the next halving is due in 2028, which is expected to give the market a renewed boost. During this time, the use of SWARMS is expected to increase significantly and or even enter a new phase with an average price of $10.50.
2029
The cryptocurrency market is expected to stabilize by 2029, meaning that SWARMS will benefit from durable expansion and utilization. In the backdrop of this bullish outlook, this yields an AM of $32 with a Hi of $45 for SWARMS. This shows that the token has been running well in the market, and constant advancements are happening in the ecosystem.
Conclusion
Swarms (SWARMS) has shown strong potential in the cryptocurrency market, supported by robust technical indicators and promising long-term projections. As the token continues to gain traction, its innovative ecosystem and growing adoption position it for significant future growth. With forecasts suggesting notable price increases by 2029, SWARMS remains a cryptocurrency to watch closely.
FAQs
- What is Swarms (SWARMS)?
Swarms (SWARMS) is the native cryptocurrency of the Swarms Ecosystem, designed for autonomous agent networks. - What are the key technical indicators for SWARMS?
Key indicators include Bollinger Bands, RSI, and MACD, which suggest bullish momentum and possible corrections. - What is the SWARMS price prediction for 2025?
SWARMS is predicted to reach an average price of $3.50 in 2025, with a maximum potential of $10.50. - How does RSI affect SWARMS trading decisions?
RSI indicates overbought or oversold conditions, helping traders identify potential entry and exit points. - Could SWARMS reach $45 by 2029?
Projections suggest SWARMS could reach up to $45 in 2029 during a bullish market phase.
Also Read: Artificial Superintelligence Alliance (FET) Price Prediction 2024-2029: Will FET Reach $2.18 Soon?
