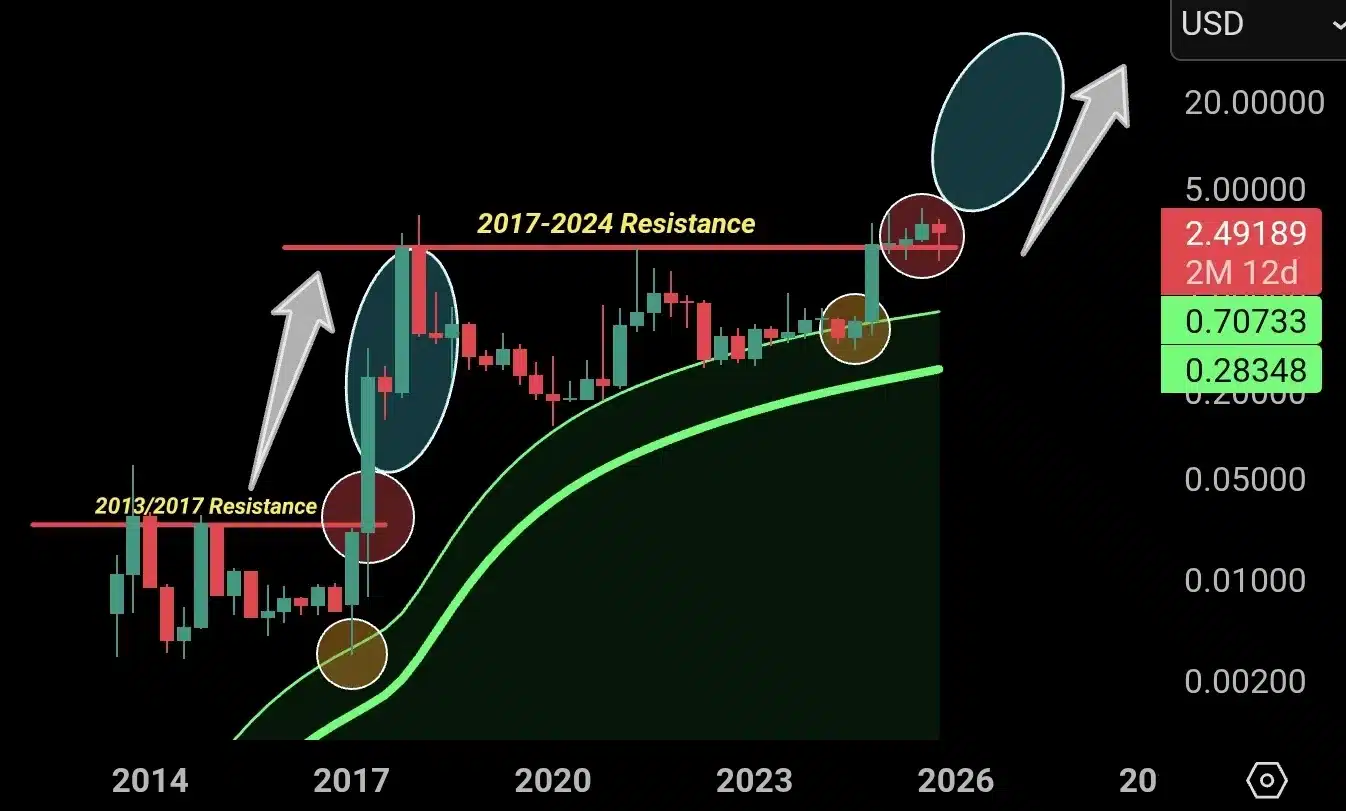
- XRP has broken above a key resistance zone that held since 2017.
- Analyst ChartNerd compares the move to XRP’s 2017 breakout that preceded a 130x rally.
- A three-month golden cross and strong support near $2.00–$2.50 reinforce the case for a long-term uptrend.
Crypto market analyst ChartNerd has sparked discussion among traders after noting that XRP has officially broken above its seven-year resistance zone, a technical level stretching from 2017 to 2024. The breakout, visible on multi-year charts, has led ChartNerd to project a potential rally of up to 12x—targeting $27 per XRP.
Seven-Year Resistance Finally Broken
In a post shared on X, ChartNerd wrote: “XRP has broken and currently sits above its prior 7-year (2017–2024) resistance.”
The chart accompanying the post illustrates XRP’s long-term price action, highlighting the 2017–2024 resistance band, a level that had previously capped every major upward attempt since the 2017 bull run. XRP’s current monthly candle appears to have closed decisively above that level, signaling what technical traders view as a potential macro breakout.
$XRP has broken and currently sits above its prior 7 year (2017-2024) resistance.
The last time $XRP broke and sat above a 4 year (2013-2017) resistance, it rallied 130x 📸
So why when I’m targeting a 12x to $27, is the target too high? 🤷♂️ The 3M GC is a major catalyst 👇 pic.twitter.com/YZF0WaExD9
— 🇬🇧 ChartNerd 📊 (@ChartNerdTA) October 20, 2025
Also Read: 50,000,000 XRP Offloaded by Ripple’s Chris Larsen – Here’s Its Destination
Lessons from the 2013–2017 Breakout
ChartNerd drew a historical parallel to XRP’s behavior in 2017, when the cryptocurrency broke through its 2013–2017 resistance. That move preceded a 130x rally, sending XRP from fractions of a cent to above $3.00 within months.
“The last time $XRP broke and sat above a 4-year (2013–2017) resistance, it rallied 130x,” ChartNerd noted. “So why, when I’m targeting a 12x to $27, is the target too high?”
The post also referenced the ‘3M GC’, short for three-month golden cross—a long-term technical indicator that occurs when a shorter-term moving average crosses above a longer-term one on the quarterly chart.
Historically, this crossover has aligned with bullish continuation phases in major crypto assets. ChartNerd cited this signal as a key catalyst behind his bullish projection, suggesting the market structure now mirrors conditions seen before XRP’s explosive 2017 move.
Chart Analysis: Technical Structure Aligns with Bullish Momentum
The accompanying chart highlights two major resistance levels, 2013/2017 and 2017/2024, each followed by significant accumulation and breakout phases. The green curved bands on the chart represent long-term moving averages, showing a consistent upward trajectory since 2022.
Following the latest breakout, XRP’s price currently sits near $2.41, above key support levels around $0.70 and $0.28. The breakout zone around $2.00–$2.50 now serves as a potential launchpad for higher targets if momentum sustains.

Source: ChartNerd/X
While a 12x rally to $27 may sound ambitious, ChartNerd argued it’s modest compared to XRP’s historical performance, particularly given the asset’s long consolidation phase and improving macro signals.
The post has sparked renewed debate within the crypto community about whether XRP is finally entering a new macro uptrend after years of stagnation.
Outlook
If XRP continues to hold above the former seven-year resistance and the broader crypto market maintains bullish sentiment, technical analysts believe the setup could mark the start of a multi-year trend reversal. As ChartNerd summarized: “The structure is there, the breakout is real, and history has a way of rhyming.”
Also Read: Santiment: XRP Crowd Sentiment Hit 9-Month Low, But There is a Catch
