The Sandbox (SAND) has broken through a key resistance level near $0.300, fueling speculation of a continued bullish run toward the $0.36 region. After rebounding from a low of $0.251 earlier in June, SAND has built a steady upward momentum supported by a sequence of higher lows and confirmed breakouts on multiple timeframes.
The latest breakout occurred above the $0.298–$0.300 supply zone, which had previously rejected several rally attempts. This relocation was coupled with an increase in volume and a retest of the previous wedge resistance, which had now become intraday support at $0.295. The short-term structure has now turned definitively in favour of bulls.
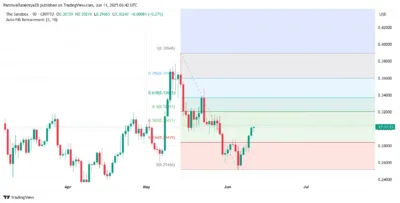
SAND is also consolidating slightly below the 0.382 Fibonacci retracement level on the daily chart at $0.3043. This area is a critical breakout area, and a break above it could lead to additional gains in the 0.5 and 0.618 retracement levels at $0.326 and $0.336. The price organization suggests that traders are observing this area to confirm the resumption of the trend.
Also Read: XRP Positioned as SWIFT’s Successor After 47-Year Cycle, Expert Claims
Indicators Signal Strong Bullish Momentum Ahead of Key Resistance Cluster
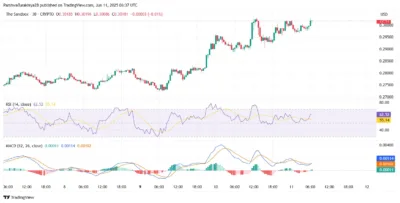
Technical indicators remain aligned with the bullish outlook, as the RSI on the 30-minute chart is rising and sits at 62.52, showing increasing strength without signalling exhaustion. Additionally, the MACD has flipped positive with growing green histogram bars, while the Stochastic RSI shows continued bullish pressure as %K crosses above %D near the upper range.
Source: Tradingview
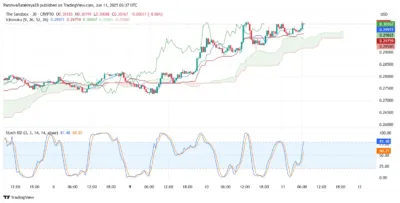
Supporting this momentum, Ichimoku Cloud analysis shows price action above the cloud base across both the 30-minute and 4-hour charts. The Tenkan-sen and Kijun-sen have completed a bullish crossover, and the Leading Span A is trending upward. These signals indicate strong support near $0.298 and reinforce the current breakout.
Source: Tradingview
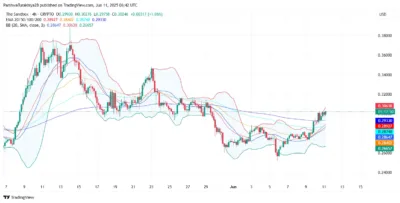
The Bollinger Bands on the 4-hour timeframe show SAND hugging the upper band, often a sign of volatility expansion rather than immediate reversal. The absence of bearish divergence on the RSI further supports the likelihood of additional gains in the short term.
Medium-Term Outlook Points to $0.36 If Breakout Strength Holds
Looking at the medium-term chart, SAND is forming an ascending triangle pattern. Resistance sits around $0.304, with rising trendline support building from the $0.27 level. The 20, 50, and 100 EMAs have now flipped into support, positioned between $0.284 and $0.293. The 200 EMA at $0.306 is currently being tested, and a clean move above could open the door to higher targets.
Source: Tradingview
On the weekly chart, the price has reclaimed the 0.236 Fibonacci level at $0.341, adding strength to a reversal structure that has been forming after several months of decline. In case the bullish momentum continues, traders believe that SAND will challenge the next Fib retrospective at 0.3431 and potentially break towards the $0.36 -$0.38 area in the forthcoming weeks.
Source: Tradingview
As the sentiment in the metaverse industry recovers and buyers respond robustly to essential help areas, The Sandbox seems ready to attack in a possible mid-term rally. Nevertheless, traders will pay close attention to the price action of $0.304 and $0.310 to confirm further bullish control.
Also Read: FTX Strikes Back: Shaq Pays Millions as Binance Battles $1.7B Lawsuit
