USUAL is the governance token of the Usual protocol, offering users control over its infrastructure and treasury. Unlike traditional tokens, USUAL derives its intrinsic value from the protocol’s revenue, driving the adoption of USD0 and aligning incentives for contributors.
The unique distribution model of $USUAL unlocks new possibilities in the decentralized finance (DeFi) space while fostering sustainable decentralization and promoting ecosystem growth. Based on its market dynamics and technical analysis, this article will explore the price predictions for $USUAL from 2025 to 2028.
Also Read: Top 10 Meme Coins: A Deep Look into Organic Community Influence and Corporate Control
Usual Price Analysis: Key Indicators
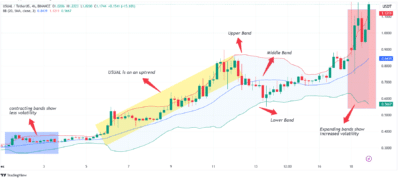
Bollinger Bands Analysis
Bollinger Bands provides insight into price volatility by showing the upper, middle, and lower price limits. Currently, $USUAL is testing the upper band and is considered overbought. This suggests a potential retracement toward the Simple Moving Average (SMA), possibly dropping to $0.85. If this happens, the price could consolidate before experiencing another upward trend.

Source: Tradingview
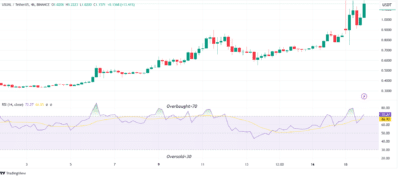
Relative Strength Index (RSI) Analysis
The Relative Strength Index (RSI) helps identify whether an asset is overbought or oversold. The asset is overbought when the RSI is above 70, while below 30 indicates it is oversold. The current RSI reading for $USUAL suggests that it is overbought, which could result in a short-term price correction before any further upward movement.

Source: Tradingview
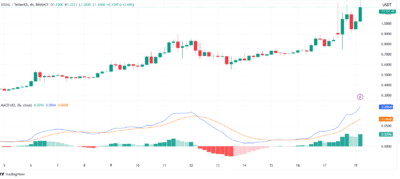
Moving Average Convergence Divergence (MACD) Analysis
The MACD is a momentum indicator that uses two exponential moving averages (EMA) to track an asset’s performance. $USUAL’s MACD shows a positive reading of 0.096, signaling that the token is gaining value.
The increasing distance between the MACD line and the signal line, indicated by growing green histogram bars, suggests that $USUAL is on an upward trend, supported by strong momentum.

Source: Tradingview
Price Prediction for $USUAL (2025-2028)
The price predictions for $USUAL provide a roadmap of its potential growth trajectory over the next few years. Based on various indicators such as market sentiment, protocol performance, and DeFi adoption, the following table outlines the expected price ranges:
| Year | Minimum Price | Average Price | Maximum Price |
| 2025 | $1.8 | $2.5 | $4.5 |
| 2026 | $0.85 | $1.35 | $2.25 |
| 2027 | $1.5 | $1.85 | $2.35 |
| 2028 | $2.25 | $2.85 | $3.75 |
Usual Price Prediction: Year-by-Year Outlook
2025: A Year of Growth and Bullish Sentiment
In 2025, $USUAL is expected to continue its growth, supported by its innovative revenue-driven model and the increasing adoption of DeFi protocols. The token could see a significant rise, reaching a minimum price of $1.8, an average of $2.5, and potentially peaking at $4.5.
A bullish market and increasing investor interest in decentralized platforms could help propel $USUAL to new heights.
2026: A Bear Market Correction
Following the bull run, the market will likely enter a correction phase, with bearish sentiment affecting many cryptocurrencies. During this time, $USUAL could see a decline in value, potentially reaching a minimum price of $0.85 and trading at an average of $1.35.
The market correction could cause a temporary slowdown, but $ USUAL’s fundamentals will help weather the storm.
2027: Market Stabilization and Recovery
2027, the cryptocurrency market is expected to stabilize as it recovers from the bearish period. With a gradual recovery, $USUAL’s price could consolidate and hover between $1.5 and $2.35. As the market begins to heal, $USUAL could gain momentum again, especially if DeFi adoption continues to increase.
2028: A Renewed Bull Market and Potential Surge
By 2028, $USUAL could experience another significant surge, potentially reaching $3.75. As Bitcoin’s halving event and other altcoin growth catalysts occur, market sentiment may shift positively, benefiting decentralized protocols like Usual.
The strong foundation laid by $USUAL’s unique value proposition will likely drive its price higher, with $2.85 being a realistic target by the end of the year.
Conclusion
$USUAL is well-positioned for long-term growth, driven by its revenue-sharing model, strong community support, and increasing DeFi adoption. While short-term fluctuations are inevitable, the protocol’s fundamentals suggest that $USUAL will continue to perform well over the next several years. The predictions for 2025-2028 indicate that, despite periods of market consolidation, $ USUAL’s value is likely to increase significantly, making it a promising investment for those looking to capitalize on the growth of decentralized finance.
FAQs:
- What is $USUAL used for?
$USUAL is the governance token for the Usual protocol, granting users control over the protocol’s infrastructure and treasury. - Why is $USUAL’s price predicted to increase in 2025?
$ USUAL’s innovative revenue-driven model and growing DeFi adoption are expected to drive its price upward in 2025. - What factors could cause $USUAL’s price to drop in 2026?
A potential bear market correction in 2026 could lead to a decline in $ USUAL’s price as market sentiment turns negative. - How does $ USUAL’s unique distribution model affect its price?
$ USUAL’s distribution model, based on protocol revenue, provides intrinsic value, helping to support its long-term price growth and stability.
Also Read: Vana (VANA) Price Predictions for the Year 2025-2028
