Verge (XVG) has distinguished itself from other cryptocurrencies with its innovative approach to token distribution. Unlike most projects, Verge did not hold an Initial Coin Offering (ICO), which means no tokens were pre-allocated to the development team.
All circulating XVG tokens were mined through the Verge blockchain’s proof-of-work consensus mechanism. As of now, the circulating supply of Verge is 16.52 billion XVG. The project intentionally set its supply cap high to ensure individual token values remain low, eliminating the need for fractional payments.
Moreover, this high supply cap makes it challenging for individuals or entities to amass enough tokens to manipulate market prices.
Also Read: Dogecoin Price Prediction for 2024 to 2027: Short-Term and Long-Term Outlook with Technical Insights
Bollinger Bands Analysis
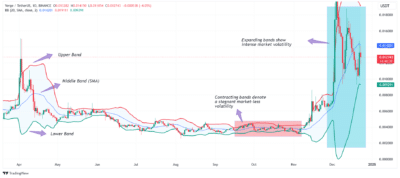
The Bollinger Bands are a key technical indicator providing insight into market volatility. They consist of three bands: the upper band, middle band (or SMA), and lower band. These bands expand and contract based on market conditions.
A wider gap between the bands typically indicates heightened volatility and the potential for significant price swings, while narrower bands signal reduced volatility.

Source: Tradingview
Verge (XVG) is forming lower highs within gaping Bollinger Bands, indicating fierce competition between bullish and bearish forces. After nearing the lower band, XVG rebounded, forming a lower high near the SMA.
If the bulls push the price past the SMA, Verge could gain upward momentum and approach the upper band. Conversely, failure to break above the SMA could lead to continued consolidation or downward movement.
Relative Strength Index (RSI)
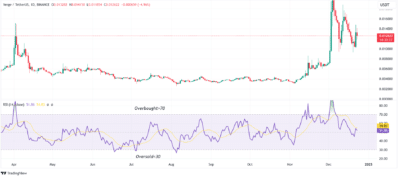
The Relative Strength Index (RSI) is another valuable tool for assessing Verge’s price trajectory. The RSI sits at 51, a neutral position trending toward the oversold region, and could drop below 30 if bears persist, indicating an undervalued price.

Source: Tradingview
Additionally, the RSI line is below its SMA, reinforcing that Verge is underperforming in the current market. Historical trends show that the RSI can help spot trend reversals, mainly when the token’s price and the RSI move in opposite directions. Traders should keep an eye on this metric as it may signal upcoming changes in market momentum.
MACD Analysis: Weak Momentum but Buyer Potential
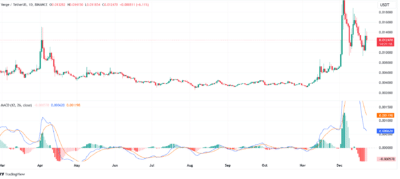
The Moving Average Convergence and Divergence (MACD) is a momentum indicator used to evaluate Verge’s performance. The MACD value of 0.000622 is below the signal line, highlighting declining bullish momentum. Red histogram bars indicate that the MACD line is moving further away from the SMA, pointing to bearish pressure.

Source: Tradingview
However, the MACD remains positive, suggesting that buyers could intervene and prevent Verge from falling into a prolonged bearish phase. If buying pressure increases, Verge might regain momentum and stabilize above current levels.
Price Predictions: Verge’s Trajectory for 2025 to 2028
Broader market cycles, technological developments, and historical patterns will likely influence the Verge’s price trajectory over the next few years.
| Year | Minimum Price | Average Price | Maximum Price |
| 2025 | $0.02 | $0.05 | $0.10 |
| 2026 | $0.025 | $0.085 | $0.15 |
| 2027 | $0.085 | $0.15 | $0.85 |
| 2028 | $0.25 | $0.75 | $1.85 |
Verge Price Analysis for 2025
As Verge continues to gain traction, its price may experience significant upward movement in 2025. After being supported at $0.01, Verge has the potential to break through resistance levels and reach $0.1 during a bull run. If market conditions remain favorable, Verge could surpass these levels as investor confidence grows.
Verge Price Analysis for 2026
In 2026, the market is expected to enter a bearish phase due to its cyclical nature, causing Verge to lose some momentum gained in 2025. Price corrections could drive Verge back to its support level of $0.025. This phase could provide opportunities for long-term investors to accumulate Verge at lower prices.
Verge Price Analysis for 2027
As the market begins to recover from bearish sentiment, Verge could stabilize in 2027. Traders are likely to remain cautious, leading to gradual price movement. Verge’s price could consolidate around $0.15 during this period as the market regains its footing.
Verge Price Analysis for 2028
With the next Bitcoin halving expected in 2028, the cryptocurrency market could experience a significant resurgence. Verge may benefit from this renewed optimism, potentially surging to $0.75 or higher by the end of the year. If Verge continues to build on its technological advancements, it could attract more attention and push prices toward $1.85.
In conclusion, Verge’s unique distribution model, historical patterns, and technical indicators point to a mix of challenges and opportunities. Investors should monitor key metrics and market cycles to make informed decisions.
FAQs
- What makes Verge unique among cryptocurrencies?
Verge is unique as it launched without an ICO, with all tokens mined through proof-of-work and none pre-allocated to the team. - Why was Verge’s supply cap set so high?
The high supply cap ensures low token values, making fractional payments unnecessary and preventing market manipulation by large holders. - How does the Bollinger Bands indicator help predict Verge’s price?
Bollinger Bands measures volatility, with expanding bands signaling price swings and wide bands hinting at significant market activity. - What is the importance of the RSI in analyzing Verge’s price?
The RSI shows if Verge is overbought or oversold, with values above 70 indicating overbought and below 30 indicating oversold. - What are Verge’s long-term price predictions?
Verge could reach $0.1 by 2025, consolidate around $0.15 by 2027, and surge to $1.85 following the Bitcoin halving in 2028.
Also Read: Shiba Inu (SHIB) Price Analysis: Predictions for 2024 to 2026
