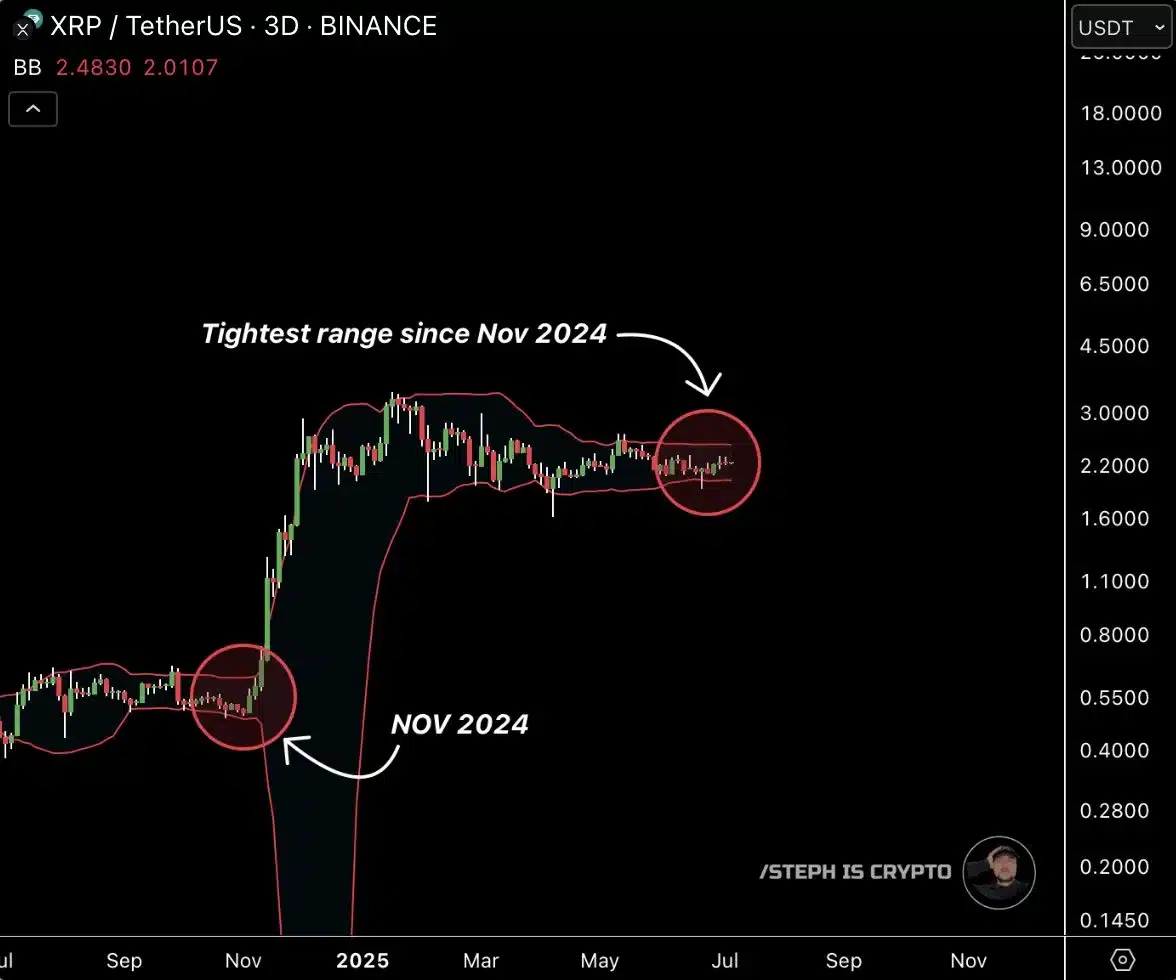
- XRP’s Bollinger Bands are showing a rare squeeze, last seen before a 600% rally.
- Analysts see bullish signals, with some predicting XRP could break past its all-time high.
- Broader factors, including Ripple’s partnerships and crypto regulations, could heavily influence XRP’s next move.
XRP, the digital asset native to the Ripple ecosystem, has been consolidating within a narrow price range of $2.15 to $2.30 over the past week. Technical indicators now suggest the cryptocurrency could be on the cusp of a significant price swing, with market watchers closely eyeing a possible breakout.
Prominent crypto analyst STEPH IS CRYPTO highlighted on social platform X that XRP’s Bollinger Bands have compressed to levels not seen since November of last year. Historically, this type of “squeeze” has signaled an impending surge in volatility.
Back in November, XRP traded near $0.50 before exploding by more than 600% in the months that followed, briefly approaching $3.40.
If a similar move materializes from XRP’s current price around $2.27, a proportional rally could send the token above $16, an unprecedented level in XRP’s trading history.
Also Read: Pundit Claims Wall Street is ‘Terrified’ of XRP – Here’s Why
The #XRP Bollinger Bands are extremely tight.
BIG PUMP INCOMING! pic.twitter.com/btbtZkR8pb
— STEPH IS CRYPTO (@Steph_iscrypto) July 6, 2025
Bollinger Band Squeeze Hints at Explosive Potential
Bollinger Bands, a technical analysis tool that measures volatility relative to recent price trends, are widely used by traders to identify periods of market compression that often precede large price movements.
A squeeze occurs when the bands contract tightly around the asset’s price, signaling declining volatility, a condition often followed by a breakout in either direction.
Historical patterns suggest the last Bollinger squeeze coincided with key macroeconomic and political developments, including Donald Trump’s election victory, which boosted risk appetite across financial markets.
Analysts caution that while technical signals provide valuable insight, external factors like regulatory changes or broader market sentiment shifts can also heavily influence outcomes.

Source: Steph is Crypto/X
Analysts Predict XRP’s Next Bullish Breakout
The cryptocurrency community remains divided on the magnitude of XRP’s next move, but several respected analysts have expressed bullish expectations.
X user CRYPTOWZRD noted that XRP has spent the past 32 weeks in a consolidation phase, a technical setup they argue indicates the token is “gathering strength” for its next leg upward. According to their analysis, the appearance of one more bullish weekly candle could ignite a significant upward trend.
Adding to the optimism, analyst Captain Faibik set a short-term price target of $4.60, which would mark a new all-time high for the asset.
They suggested that the prolonged consolidation, combined with tightening Bollinger Bands, makes XRP a prime candidate for an imminent rally.
Broader Market Context Could Influence XRP’s Path
While technical patterns offer strong signals, market participants are also keeping an eye on macroeconomic trends and industry developments.
Ripple’s ongoing efforts to expand its global partnerships and the recent uptick in institutional interest in crypto assets could provide additional tailwinds.
Moreover, sentiment surrounding potential changes in U.S. crypto regulations and growing adoption of blockchain solutions in cross-border finance are expected to play crucial roles in determining the extent of XRP’s next move.
As XRP trades near $2.27, traders and investors alike are watching closely for signs of a decisive breakout, one that could either validate bullish forecasts or challenge them with a sharp correction.
Also Read: ‘Something Strange is Happening’ – Pundit Notifies XRP Holders
