XRP is once again drawing attention across the crypto market as fresh technical analysis points toward a possible breakout. According to analyst EGRAG CRYPTO, several chart patterns and key support levels indicate that the digital asset may be preparing for a major upward move.
In a recent post shared on X, EGRAG addressed a common misconception surrounding XRP’s market capitalization. He answered that market cap is not the direct measure of capital inflow but an indication of price times circulating supply. This misconception, he explained, has been the basis of wrong assumptions regarding the price ceiling of XRP.
The analyst further added that in a good bull run, the market cap can increase many times more than the real money flowing into the asset. Using different stages in past market cycles as a reference, he stated that every dollar invested in XRP had the potential to increase the market cap by up to 15-30 fold. One estimate went as high as to project a 601x multiplier, justifying a market cap of $1.5 trillion.
Also Read: Time Running Out: Expert Warns You’ll Soon Never Own a Full Bitcoin Again
Technical Signals and Historical Patterns Point to a Breakout
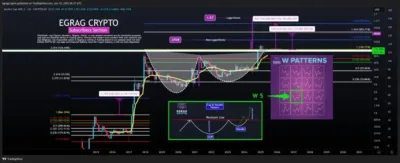
EGRAG has been closely tracking a large W pattern on XRP’s long-term chart, also known as a cup and handle formation. According to him, XRP has remained above its monthly close from the previous all-time high and has held key Fibonacci support levels since December 2024. These signs suggest a continued accumulation phase and building momentum.
The analyst used Fibonacci extensions to offer several potential price targets, with one conservative estimate indicating $4.50, backed by a 270 billion dollar market cap. On a log scale, the target increases to $25 with a market cap of $1.5 trillion. EGRAG also used the previous price increase of XRP in 2017 by 242 percent between the 1.0 and 1.618 Fibonacci Retracement levels, extending a comparable rise to $7.60.

Source: EGRAG
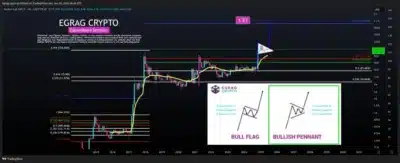
Additional bullish indicators include a visible pennant formation on both XRP/USD and XRP/BTC charts. This trend corresponds to a future price of 20 dollars and a 1.2 trillion dollar market cap. EGRAG also highlighted the presence of a kicking bull flag, which has a higher success rate of breakouts than the pennant formation in the past.

Currently trading at $2.29, XRP is still a long way off the described targets. Nonetheless, the technical patterns and historical analogy indicate that the asset might be setting up for a breakout and may soon enter the two-digit price territory.
Conclusion
Chart analysis from EGRAG CRYPTO has reignited interest in XRP’s potential for a sharp rally. With strong support levels, bullish formations, and Fibonacci indicators aligning, XRP appears to be on the verge of a significant price move.
Also Read: Whale Buys Back $46M in ETH After Dumping—Here’s What Sparked the Surge
